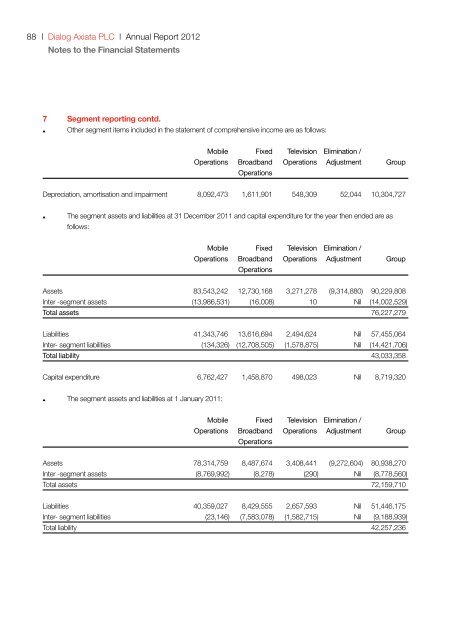
88 l <strong>Dialog</strong> Axiata PLC l <strong>Annual</strong> <strong>Report</strong> <strong>2012</strong> Notes to the Financial Statements 7 Segment reporting contd. Other segment items included in the statement of comprehensive income are as follows: Mobile Fixed Television Elimination / Operations Broadband Operations Adjustment Group Operations Depreciation, amortisation and impairment 8,092,473 1,611,901 548,309 52,044 10,304,727 The segment assets and liabilities at 31 December 2011 and capital expenditure for the year then ended are as follows: Mobile Fixed Television Elimination / Operations Broadband Operations Operations Adjustment Group Assets 83,543,242 12,730,168 3,271,278 (9,314,880) 90,229,808 Inter -segment assets (13,986,531) (16,008) 10 Nil (14,002,529) Total assets 76,227,279 Liabilities 41,343,746 13,616,694 2,494,624 Nil 57,455,064 Inter- segment liabilities (134,326) (12,708,505) (1,578,875) Nil (14,421,706) Total liability 43,033,358 Capital expenditure 6,762,427 1,458,870 498,023 Nil 8,719,320 The segment assets and liabilities at 1 January 2011: Mobile Fixed Television Elimination / Operations Broadband Operations Operations Adjustment Group Assets 78,314,759 8,487,674 3,408,441 (9,272,604) 80,938,270 Inter -segment assets (8,769,992) (8,278) (290) Nil (8,778,560) Total assets 72,159,710 Liabilities 40,359,027 8,429,555 2,657,593 Nil 51,446,175 Inter- segment liabilities (23,146) (7,583,078) (1,582,715) Nil (9,188,939) Total liability 42,257,236
8 Property, plant and equipment (a) Group <strong>Annual</strong> <strong>Report</strong> <strong>2012</strong> l <strong>Dialog</strong> Axiata PLC l 89 Computer Furniture, Assets in the systems fittings course of Land and and telecom and other Motor construction buildings equipment equipment vehicles (CWIP) Total At 1 January 2011 Cost 1,385,284 74,958,195 3,336,681 482,827 10,115,972 90,278,959 Accumulated depreciation / provision for impairment (423,456) (32,077,023) (2,008,495) (412,934) (2,342,700) (37,264,608) Net book amount 961,828 42,881,172 1,328,186 69,893 7,773,272 53,014,351 Year ended 31 December 2011 Opening net book amount 961,828 42,881,172 1,328,186 69,893 7,773,272 53,014,351 Additions Nil 163,682 6,877 Nil 8,308,643 8,479,202 Transferred from CWIP 9,083 10,901,897 528,921 27,619 (11,467,520) Nil Transferred to intangible assets (Note 9) Nil Nil Nil Nil (332,034) (332,034) Acquisition of subsidiary 13,851 30,386 16,676 Nil Nil 60,913 Disposal of subsidiary (13,497) (29,405) (16,275) Nil Nil (59,177) Disposals (19,801) (40,552) (21,999) (133) Nil (82,485) Adjustments Nil (14,437) (13,117) Nil (35,517) (63,071) Impairment reversal / (provision) Nil 37,393 Nil Nil (117,293) (79,900) Reclassification to trading inventory Nil Nil Nil Nil (187,144) (187,144) Depreciation (104,654) (8,827,889) (643,443) (47,130) Nil (9,623,116) Closing net book amount 846,810 45,102,247 1,185,826 50,249 3,942,407 51,127,539 At 31 December 2011 Cost 1,329,674 83,580,043 3,793,089 506,360 6,675,177 95,884,343 Accumulated depreciation / provision for impairment (482,864) (38,477,796) (2,607,263) (456,111) (2,732,770) (44,756,804) Net book amount 846,810 45,102,247 1,185,826 50,249 3,942,407 51,127,539 Year ended 31 December <strong>2012</strong> Opening net book amount 846,810 45,102,247 1,185,826 50,249 3,942,407 51,127,539 Additions Nil 277,188 18,479 Nil 17,289,919 17,585,586 Transferred from CWIP 16,611 11,818,087 765,772 144 (12,600,614) Nil Transferred to intangible assets (Note 9) Nil Nil Nil Nil (460,550) (460,550) Acquisition through business combination (Note 36) 22,707 1,902,301 9,707 1,740 105,291 2,041,746 Disposals Nil (6,665) (4,934) (205) Nil (11,804) Adjustments (9,276) (197,380) (3,584) Nil (225,277) (435,517) Impairment provision Nil (547,611) (86,131) Nil (151,637) (785,379) Reclassification from trading inventory Nil Nil Nil Nil 100,071 100,071 Depreciation (75,850) (9,402,147) (589,201) (30,819) Nil (10,098,017) Closing net book amount 801,002 48,946,020 1,295,934 21,109 7,999,610 59,063,675 At 31 December <strong>2012</strong> Cost 1,351,560 111,037,104 4,855,373 502,773 10,471,204 128,218,014 Accumulated depreciation / provision for impairment (550,558) (62,091,084) (3,559,439) (481,664) (2,471,594) (69,154,339) Net book amount 801,002 48,946,020 1,295,934 21,109 7,999,610 59,063,675


![nrypq;Nfh ,d;#ud;;]; nfhk;gdp ypkplw - Dialog](https://img.yumpu.com/15429071/1/190x245/nrypqnfh-dud-nfhkgdp-ypkplw-dialog.jpg?quality=85)