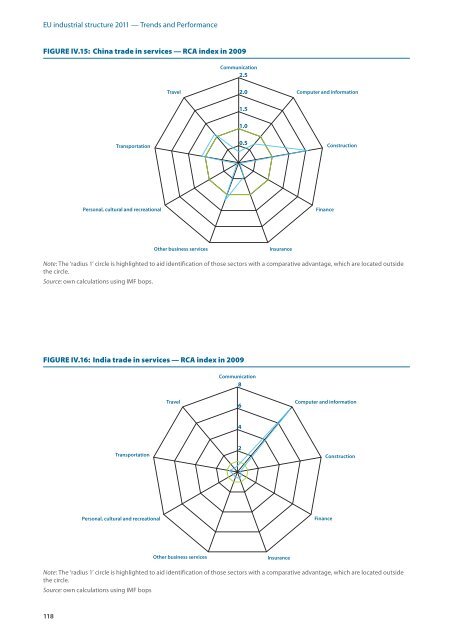
<strong>EU</strong> <strong>industrial</strong> <strong>structure</strong> 2011 — Trends and Performance FIgURE IV.15: China trade in services — RCA index in 2009 118 Transportation Personal, cultural and recreational Travel Communication 2.5 2.0 1.5 1.0 0.5 Other business services Insurance Computer and information Finance Construction Note: The ‘radius 1’ circle is highlighted to aid identification of those sectors with a comparative advantage, which are located outside the circle. Source: own calculations using IMF bops. FIgURE IV.16: India trade in services — RCA index in 2009 Transportation Personal, cultural and recreational Travel Communication 8 Other business services Insurance 6 4 2 Computer and information Finance Construction Note: The ‘radius 1’ circle is highlighted to aid identification of those sectors with a comparative advantage, which are located outside the circle. Source: own calculations using IMF bops
FIgURE IV.17: Russia trade in services — RCA index in 2009 Transportation Personal, cultural and recreational Travel Communication 3.0 Chapter IV — International competitiveness of <strong>EU</strong> industry 2.5 2.0 1.5 1.0 0.5 Other business services Insurance Computer and information Finance Construction Note: The ‘radius 1’ circle is highlighted to aid identification of those sectors with a comparative advantage, which are located outside the circle. Source: own calculations using IMF bops. IV.3 Intra-industry trade Trade was analysed for broad categories of products in the previous section. Part of international trade consists in countries exchanging products (inter‑industry trade) reflecting relative different factor (labour and capital) endowments and technology. Countries which are relatively endowed with capital tend to trade capital intensive goods in exchange for labour intensive goods from countries which are relatively well endowed with labour: for example, pharmaceuticals for textiles or motor cars for food. In section IV.1, the international trade network was presented in terms of trade flows between geographic regions. However, a large proportion of trade comprises exchange of similar goods between countries which have comparable levels of income, such as different brands of cars and clothes. This type of trade, intra‑industry trade (IIT) is explained by factors such as economies of scale and demand for differentiated products, rather than by relative factor endowments. As demand for differentiated products and varieties of different qualities tend to rise with income, per capita incomes of countries play an important role in determining trade patterns. About 53 % of world trade occurs between countries in the groups composed of the <strong>EU</strong>‑27 and other high‑income countries. If upper‑medium countries are included, this share rises to almost 70 %. While trade between different types of countries (e.g. high and upper‑medium income countries on the one hand and low and low‑medium income countries on the other) can be expected to involve goods produced with differences in factor intensities, the exchange of goods between high‑income countries suggests a different pattern of trade. However, IIT also involves trade between high‑income and lower‑income countries as well as between the lower‑income countries themselves, cf. Table IV.10. 74 74 The classification by income level that was used is the one from the World Bank. The country groups are: High non‑<strong>EU</strong>: Australia, Bahamas, Bahrain, Brunei Darussalam, Canada, Croatia, China, Hong Kong SAR, Iceland, Israel, Japan, Rep. of Korea, Kuwait, China, Macao SAR, Oman, Neth. Antilles, New Zealand, Norway, Qatar, Saudi Arabia, Singapore, Switzerland, United Arab Emirates, USA. Upper‑medium: Algeria, Argentina, Bosnia Herzegovina, Botswana, Brazil, Belarus, Chile, Colombia, Costa Rica, Cuba, Dominican Rep., Equatorial Guinea, Gabon, Jamaica, Kazakhstan, Lebanon, Libya, Malaysia, Mauritius, Mexico, Montenegro, Namibia, Panama, Russian Federation, Serbia, South Africa, Suriname, Trinidad and Tobago, Turkey, TFYR of Macedonia, Uruguay, Venezuela. Low‑medium: Albania, Angola, Azerbaijan, Armenia, Bolivia, Belize, Cameroon, Cape Verde, Sri Lanka, China, Ecuador, El Salvador, Djibouti, Georgia, Guatemala, Honduras, Indonesia, Iran, Iraq, Côte d’Ivoire, Jordan, Lesotho, Maldives, Mongolia, Rep. of Moldova, Morocco, Nicaragua, Nigeria, Paraguay, Peru, Philippines, Timor-Leste, India, Swaziland, Syria, Thailand, Tunisia, Ukraine, Egypt. Low: Afghanistan, Bangladesh, Bhutan, Myanmar, Burundi, Cambodia, Central African Rep., Chad, Comoros, Congo, Dem. Rep. of the Congo, Benin, Ethiopia, Eritrea, Gambia, Ghana, Guinea, Haiti, Kenya, Dem. People’s Rep. of Korea, Kyrgyzstan, Lao People’s Dem. Rep., Liberia, Madagascar, Malawi, Mali, Mauritania, Mozambique, Nepal, Niger, Pakistan, Guinea-Bissau, Rwanda, Senegal, Sierra Leone, Viet Nam, Somalia, Zimbabwe, Sudan, Tajikistan, Togo, Uganda, United Rep. of Tanzania, Burkina Faso, Uzbekistan, Yemen, Zambia. 119