

EU industrial structure - EU Bookshop - Europa
EU industrial structure - EU Bookshop - Europa
EU industrial structure - EU Bookshop - Europa

You also want an ePaper? Increase the reach of your titles
YUMPU automatically turns print PDFs into web optimized ePapers that Google loves.
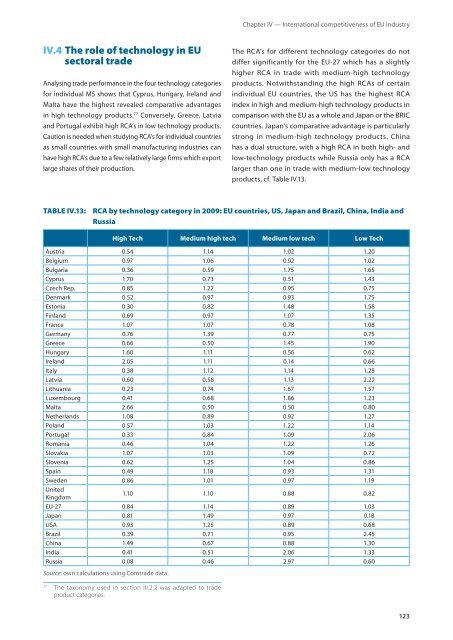
IV.4 The role of technology in <strong>EU</strong><br />
sectoral trade<br />
Analysing trade performance in the four technology categories<br />
for individual MS shows that Cyprus, Hungary, Ireland and<br />
Malta have the highest revealed comparative advantages<br />
in high technology products. 77 Conversely, Greece, Latvia<br />
and Portugal exhibit high RCA’s in low technology products.<br />
Caution is needed when studying RCA’s for individual countries<br />
as small countries with small manufacturing industries can<br />
have high RCA’s due to a few relatively large firms which export<br />
large shares of their production.<br />
77 The taxonomy used in section III.2.2 was adapted to trade<br />
product categories.<br />
Chapter IV — International competitiveness of <strong>EU</strong> industry<br />
The RCA’s for different technology categories do not<br />
differ significantly for the <strong>EU</strong>‑27 which has a slightly<br />
higher RCA in trade with medium‑high technology<br />
products. Notwithstanding the high RCAs of certain<br />
individual <strong>EU</strong> countries, the US has the highest RCA<br />
index in high and medium‑high technology products in<br />
comparison with the <strong>EU</strong> as a whole and Japan or the BRIC<br />
countries. Japan’s comparative advantage is particularly<br />
strong in medium‑high technology products. China<br />
has a dual <strong>structure</strong>, with a high RCA in both high‑ and<br />
low‑technology products while Russia only has a RCA<br />
larger than one in trade with medium‑low technology<br />
products, cf. Table IV.13.<br />
TAbLE IV.13: RCA by technology category in 2009: <strong>EU</strong> countries, US, Japan and brazil, China, India and<br />
Russia<br />
high tech medium high tech medium low tech low tech<br />
Austria 0.54 1.14 1.02 1.20<br />
Belgium 0.97 1.06 0.92 1.02<br />
Bulgaria 0.36 0.59 1.75 1.65<br />
Cyprus 1.70 0.73 0.51 1.43<br />
Czech Rep. 0.85 1.22 0.95 0.75<br />
Denmark 0.52 0.97 0.93 1.75<br />
Estonia 0.30 0.82 1.48 1.58<br />
Finland 0.69 0.97 1.07 1.35<br />
France 1.07 1.07 0.78 1.08<br />
Germany 0.76 1.39 0.77 0.75<br />
Greece 0.66 0.50 1.45 1.90<br />
Hungary 1.60 1.11 0.56 0.62<br />
Ireland 2.05 1.11 0.14 0.66<br />
Italy 0.38 1.12 1.14 1.28<br />
Latvia 0.60 0.58 1.13 2.22<br />
Lithuania 0.23 0.74 1.67 1.57<br />
Luxembourg 0.41 0.68 1.86 1.23<br />
Malta 2.66 0.50 0.50 0.80<br />
Netherlands 1.08 0.89 0.92 1.27<br />
Poland 0.57 1.03 1.22 1.14<br />
Portugal 0.33 0.84 1.09 2.06<br />
Romania 0.46 1.04 1.22 1.26<br />
Slovakia 1.07 1.03 1.09 0.72<br />
Slovenia 0.62 1.25 1.04 0.86<br />
Spain 0.49 1.18 0.93 1.31<br />
Sweden 0.86 1.01 0.97 1.19<br />
United<br />
Kingdom<br />
1.10 1.10 0.88 0.82<br />
<strong>EU</strong>‑27 0.84 1.14 0.89 1.03<br />
Japan 0.81 1.49 0.97 0.18<br />
USA 0.93 1.25 0.89 0.68<br />
Brazil 0.39 0.71 0.95 2.45<br />
China 1.49 0.67 0.88 1.30<br />
India 0.41 0.51 2.06 1.33<br />
Russia 0.08 0.46 2.97 0.60<br />
Source: own calculations using Comtrade data.<br />
123


