

EU industrial structure - EU Bookshop - Europa
EU industrial structure - EU Bookshop - Europa
EU industrial structure - EU Bookshop - Europa

You also want an ePaper? Increase the reach of your titles
YUMPU automatically turns print PDFs into web optimized ePapers that Google loves.
<strong>EU</strong> <strong>industrial</strong> <strong>structure</strong> 2011 — Trends and Performance<br />
focus on how the recession has affected <strong>EU</strong>‑27 manufacturing<br />
and services industries. The latest recession did not affect all<br />
industries in the same way: some industries are more sensitive<br />
to cyclical fluctuations and were therefore hit harder. The<br />
impact of the recession on different <strong>EU</strong> industries will be<br />
analysed in terms of size, duration and diffusion.<br />
i11 manufacturing recession and<br />
recovery(?)<br />
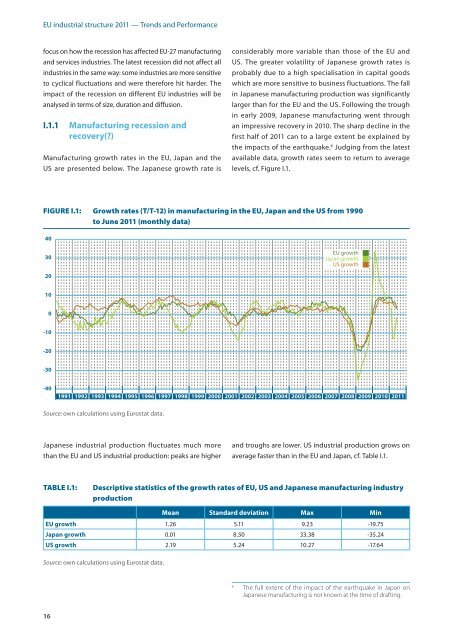
Manufacturing growth rates in the <strong>EU</strong>, Japan and the<br />
US are presented below. The Japanese growth rate is<br />
16<br />
considerably more variable than those of the <strong>EU</strong> and<br />
US. The greater volatility of Japanese growth rates is<br />
probably due to a high specialisation in capital goods<br />
which are more sensitive to business fluctuations. The fall<br />
in Japanese manufacturing production was significantly<br />
larger than for the <strong>EU</strong> and the US. Following the trough<br />
in early 2009, Japanese manufacturing went through<br />
an impressive recovery in 2010. The sharp decline in the<br />
first half of 2011 can to a large extent be explained by<br />
the impacts of the earthquake. 6 Judging from the latest<br />
available data, growth rates seem to return to average<br />
levels, cf. Figure I.1.<br />
FIgURE I.1: growth rates (T/T-12) in manufacturing in the <strong>EU</strong>, Japan and the US from 1990<br />
to June 2011 (monthly data)<br />
40<br />
30<br />
20<br />
10<br />
0<br />
-10<br />
-20<br />
-30<br />
-40<br />
1991<br />
1992<br />
1993<br />
1994<br />
1995<br />
1996<br />
Source: own calculations using Eurostat data.<br />
1997<br />
1998<br />
1999<br />
2000<br />
Japanese <strong>industrial</strong> production fluctuates much more<br />
than the <strong>EU</strong> and US <strong>industrial</strong> production: peaks are higher<br />
2001<br />
2002<br />
2003<br />
2004<br />
2005<br />
2006<br />
<strong>EU</strong> growth<br />
Japan growth<br />
US growth<br />
TAbLE I.1: Descriptive statistics of the growth rates of <strong>EU</strong>, US and Japanese manufacturing industry<br />
production<br />
2007<br />
2008<br />
2009<br />
mean standard deviation max min<br />
Eu growth 1.26 5.11 9.23 ‑19.75<br />
Japan growth 0.01 8.50 33.38 ‑35.24<br />
us growth 2.19 5.24 10.27 ‑17.64<br />
Source: own calculations using Eurostat data.<br />
2010<br />
2011<br />
and troughs are lower. US <strong>industrial</strong> production grows on<br />
average faster than in the <strong>EU</strong> and Japan, cf. Table I.1.<br />
6 The full extent of the impact of the earthquake in Japan on<br />
Japanese manufacturing is not known at the time of drafting.


