

EU industrial structure - EU Bookshop - Europa
EU industrial structure - EU Bookshop - Europa
EU industrial structure - EU Bookshop - Europa

Create successful ePaper yourself
Turn your PDF publications into a flip-book with our unique Google optimized e-Paper software.
<strong>EU</strong> <strong>industrial</strong> <strong>structure</strong> 2011 — Trends and Performance<br />
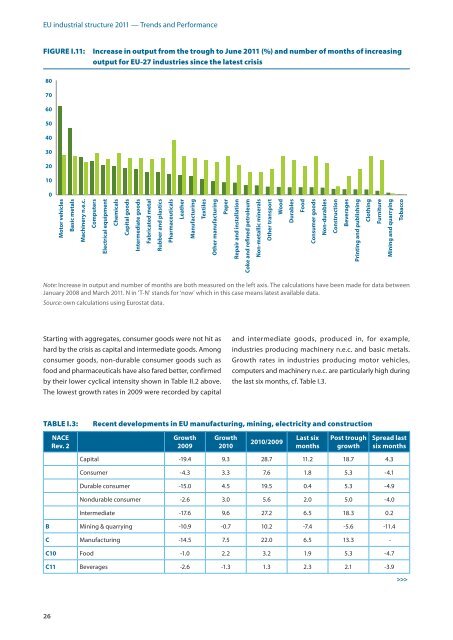
FIgURE I.11: Increase in output from the trough to June 2011 (%) and number of months of increasing<br />
output for <strong>EU</strong>-27 industries since the latest crisis<br />
80<br />
70<br />
60<br />
50<br />
40<br />
30<br />
20<br />
10<br />
0<br />
Starting with aggregates, consumer goods were not hit as<br />
hard by the crisis as capital and intermediate goods. Among<br />
consumer goods, non‑durable consumer goods such as<br />
food and pharmaceuticals have also fared better, confirmed<br />
by their lower cyclical intensity shown in Table II.2 above.<br />
The lowest growth rates in 2009 were recorded by capital<br />
26<br />
Motor vehicles<br />
Basic metals<br />
Machinery n.e.c.<br />
Computers<br />
Electrical equipment<br />
Chemicals<br />
Capital goods<br />
Intermediate goods<br />
Fabricated metal<br />
Rubber and plastics<br />
Pharmaceuticals<br />
Leather<br />
Manufacturing<br />
Textiles<br />
Other manufacturing<br />
Paper<br />
Note: Increase in output and number of months are both measured on the left axis. The calculations have been made for data between<br />
January 2008 and March 2011. N in ‘T‑N’ stands for ‘now’ which in this case means latest available data.<br />
Source: own calculations using Eurostat data.<br />
Repair and installation<br />
Coke and rened petroleum<br />
Non-metallic minerals<br />
Other transport<br />
Wood<br />
Durables<br />
Food<br />
Consumer goods<br />
Non-durables<br />
and intermediate goods, produced in, for example,<br />
industries producing machinery n.e.c. and basic metals.<br />
Growth rates in industries producing motor vehicles,<br />
computers and machinery n.e.c. are particularly high during<br />
the last six months, cf. Table I.3.<br />
TAbLE I.3: Recent developments in <strong>EU</strong> manufacturing, mining, electricity and construction<br />
nacE<br />
rev 2<br />
growth<br />
2009<br />
growth<br />
2010<br />
2010/2009<br />
last six<br />
months<br />
Construction<br />
Beverages<br />
Printing and publishing<br />
post trough<br />
growth<br />
Clothing<br />
Furniture<br />
Mining and quarrying<br />
Tobacco<br />
spread last<br />
six months<br />
Capital ‑19.4 9.3 28.7 11.2 18.7 4.3<br />
Consumer ‑4.3 3.3 7.6 1.8 5.3 ‑4.1<br />
Durable consumer ‑15.0 4.5 19.5 0.4 5.3 ‑4.9<br />
Nondurable consumer ‑2.6 3.0 5.6 2.0 5.0 ‑4.0<br />
Intermediate ‑17.6 9.6 27.2 6.5 18.3 0.2<br />
B Mining & quarrying ‑10.9 ‑0.7 10.2 ‑7.4 ‑5.6 ‑11.4<br />
c Manufacturing ‑14.5 7.5 22.0 6.5 13.3 ‑<br />
c10 Food ‑1.0 2.2 3.2 1.9 5.3 ‑4.7<br />
c11 Beverages ‑2.6 ‑1.3 1.3 2.3 2.1 ‑3.9<br />
>>>


