

EU industrial structure - EU Bookshop - Europa
EU industrial structure - EU Bookshop - Europa
EU industrial structure - EU Bookshop - Europa

Create successful ePaper yourself
Turn your PDF publications into a flip-book with our unique Google optimized e-Paper software.
Chapter I — The aftermath of the crisis — a long and uneven recovery(?)<br />
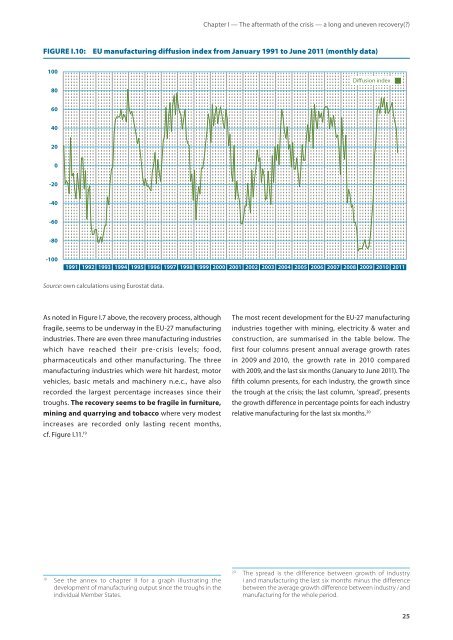
FIgURE I.10: <strong>EU</strong> manufacturing diffusion index from January 1991 to June 2011 (monthly data)<br />
100<br />
80<br />
60<br />
40<br />
20<br />
0<br />
-20<br />
-40<br />
-60<br />
-80<br />
-100<br />
1991<br />
1992<br />
1993<br />
1994<br />
1995<br />
1996<br />
Source: own calculations using Eurostat data.<br />
1997<br />
1998<br />
1999<br />
As noted in Figure I.7 above, the recovery process, although<br />
fragile, seems to be underway in the <strong>EU</strong>‑27 manufacturing<br />
2000<br />
industries. There are even three manufacturing industries<br />
which have reached their pre‑crisis levels; food,<br />
pharmaceuticals and other manufacturing. The three<br />
manufacturing industries which were hit hardest, motor<br />
vehicles, basic metals and machinery n.e.c., have also<br />
recorded the largest percentage increases since their<br />
troughs. the recovery seems to be fragile in furniture,<br />
mining and quarrying and tobacco where very modest<br />
increases are recorded only lasting recent months,<br />
cf. Figure I.11. 19<br />
19 See the annex to chapter II for a graph illustrating the<br />
development of manufacturing output since the troughs in the<br />
individual Member States.<br />
2001<br />
2002<br />
2003<br />
2004<br />
2005<br />
2006<br />
2007<br />
2008<br />
Diusion index<br />
2009<br />
2010<br />
2011<br />
The most recent development for the <strong>EU</strong>‑27 manufacturing<br />
industries together with mining, electricity & water and<br />
construction, are summarised in the table below. The<br />
first four columns present annual average growth rates<br />
in 2009 and 2010, the growth rate in 2010 compared<br />
with 2009, and the last six months (January to June 2011). The<br />
fifth column presents, for each industry, the growth since<br />
the trough at the crisis; the last column, ‘spread’, presents<br />
the growth difference in percentage points for each industry<br />
relative manufacturing for the last six months. 20<br />
20 The spread is the difference between growth of industry<br />
i and manufacturing the last six months minus the difference<br />
between the average growth difference between industry i and<br />
manufacturing for the whole period.<br />
25


