

EU industrial structure - EU Bookshop - Europa
EU industrial structure - EU Bookshop - Europa
EU industrial structure - EU Bookshop - Europa

Create successful ePaper yourself
Turn your PDF publications into a flip-book with our unique Google optimized e-Paper software.
iii42 investment demand<br />
Gross fixed capital formation (GFCF) is a measure of the<br />
net new investment by enterprises, government and<br />
households in the domestic economy in fixed capital<br />
assets, during an accounting period. GFCF is not a measure<br />
of total investment, as financial assets are not included.<br />
For that reason, this indicator gives a good insight into<br />
investment growth in the real economy. It represents a list<br />
of five product categories: metal products and machinery,<br />
transport equipment, construction work related to housing,<br />
construction work related to construction other than<br />
housing, and other products.<br />
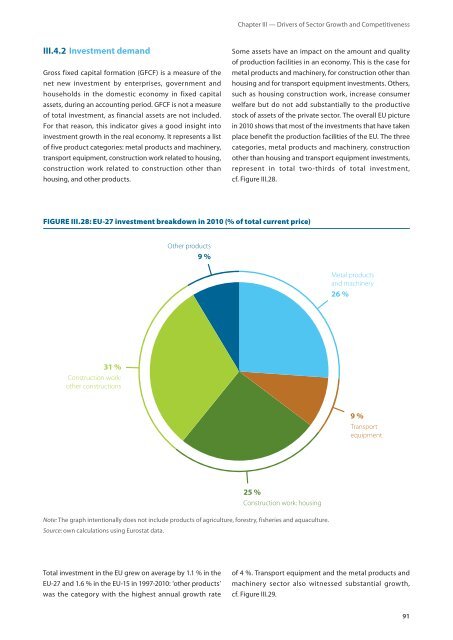
FIgURE III.28: <strong>EU</strong>-27 investment breakdown in 2010 (% of total current price)<br />
31 %<br />
Construction work:<br />
other constructions<br />
Other products<br />
9 %<br />
Chapter III — Drivers of Sector Growth and Competitiveness<br />
Some assets have an impact on the amount and quality<br />
of production facilities in an economy. This is the case for<br />
metal products and machinery, for construction other than<br />
housing and for transport equipment investments. Others,<br />
such as housing construction work, increase consumer<br />
welfare but do not add substantially to the productive<br />
stock of assets of the private sector. The overall <strong>EU</strong> picture<br />
in 2010 shows that most of the investments that have taken<br />
place benefit the production facilities of the <strong>EU</strong>. The three<br />
categories, metal products and machinery, construction<br />
other than housing and transport equipment investments,<br />
represent in total two‑thirds of total investment,<br />
cf. Figure III.28.<br />
25 %<br />
Construction work: housing<br />
Note: The graph intentionally does not include products of agriculture, forestry, fisheries and aquaculture.<br />
Source: own calculations using Eurostat data.<br />
Total investment in the <strong>EU</strong> grew on average by 1.1 % in the<br />
<strong>EU</strong>‑27 and 1.6 % in the <strong>EU</strong>‑15 in 1997‑2010: ‘other products’<br />
was the category with the highest annual growth rate<br />
Metal products<br />
and machinery<br />
26 %<br />
9 %<br />
Transport<br />
equipment<br />
of 4 %. Transport equipment and the metal products and<br />
machinery sector also witnessed substantial growth,<br />
cf. Figure III.29.<br />
91


