

EU industrial structure - EU Bookshop - Europa
EU industrial structure - EU Bookshop - Europa
EU industrial structure - EU Bookshop - Europa

You also want an ePaper? Increase the reach of your titles
YUMPU automatically turns print PDFs into web optimized ePapers that Google loves.
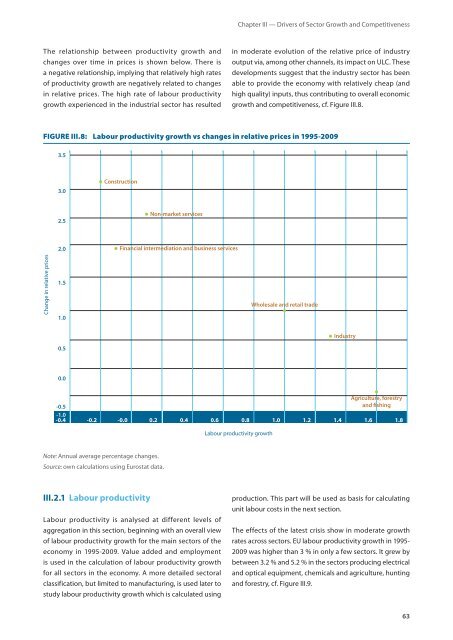
The relationship between productivity growth and<br />
changes over time in prices is shown below. There is<br />
a negative relationship, implying that relatively high rates<br />
of productivity growth are negatively related to changes<br />
in relative prices. The high rate of labour productivity<br />
growth experienced in the <strong>industrial</strong> sector has resulted<br />
Chapter III — Drivers of Sector Growth and Competitiveness<br />
in moderate evolution of the relative price of industry<br />
output via, among other channels, its impact on ULC. These<br />
developments suggest that the industry sector has been<br />
able to provide the economy with relatively cheap (and<br />
high quality) inputs, thus contributing to overall economic<br />
growth and competitiveness, cf. Figure III.8.<br />
FIgURE III.8: Labour productivity growth vs changes in relative prices in 1995-2009<br />
Change in relative prices<br />
3.5<br />
3.0<br />
2.5<br />
1.5<br />
1.0<br />
0.5<br />
0.0<br />
Construction<br />
Non-market services<br />
2.0 Financial intermediation and business services<br />
Wholesale and retail trade<br />
Industry<br />
-0.5<br />
Agriculture, forestry<br />
and fishing<br />
-1.0<br />
-0.4 -0.2 -0.0 0.2 0.4 0.6 0.8 1.0 1.2 1.4 1.6 1.8<br />
Note: Annual average percentage changes.<br />
Source: own calculations using Eurostat data.<br />
iii21 labour productivity<br />
Labour productivity is analysed at different levels of<br />
aggregation in this section, beginning with an overall view<br />
of labour productivity growth for the main sectors of the<br />
economy in 1995‑2009. Value added and employment<br />
is used in the calculation of labour productivity growth<br />
for all sectors in the economy. A more detailed sectoral<br />
classification, but limited to manufacturing, is used later to<br />
study labour productivity growth which is calculated using<br />
Labour productivity growth<br />
production. This part will be used as basis for calculating<br />
unit labour costs in the next section.<br />
The effects of the latest crisis show in moderate growth<br />
rates across sectors. <strong>EU</strong> labour productivity growth in 1995‑<br />
2009 was higher than 3 % in only a few sectors. It grew by<br />
between 3.2 % and 5.2 % in the sectors producing electrical<br />
and optical equipment, chemicals and agriculture, hunting<br />
and forestry, cf. Figure III.9.<br />
63


