

EU industrial structure - EU Bookshop - Europa
EU industrial structure - EU Bookshop - Europa
EU industrial structure - EU Bookshop - Europa

You also want an ePaper? Increase the reach of your titles
YUMPU automatically turns print PDFs into web optimized ePapers that Google loves.
<strong>EU</strong> <strong>industrial</strong> <strong>structure</strong> 2011 — Trends and Performance<br />
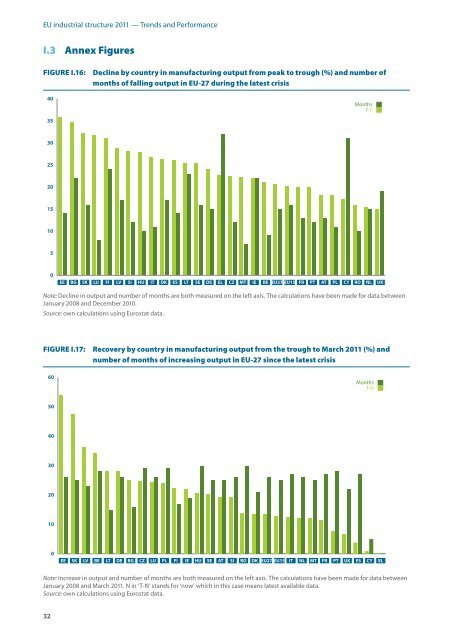
I.3 Annex Figures<br />
FIgURE I.16: Decline by country in manufacturing output from peak to trough (%) and number of<br />
months of falling output in <strong>EU</strong>-27 during the latest crisis<br />
40<br />
35<br />
30<br />
25<br />
20<br />
15<br />
10<br />
32<br />
5<br />
0<br />
EE<br />
BG<br />
SK<br />
LU<br />
FI<br />
LV<br />
SI<br />
HU<br />
IT<br />
DK<br />
ES<br />
LT<br />
SE<br />
DE<br />
EL<br />
CZ<br />
MT<br />
IE<br />
BE <strong>EU</strong>27 <strong>EU</strong>15<br />
FR<br />
PT<br />
AT<br />
PL<br />
CY<br />
Months<br />
P-T<br />
Note: Decline in output and number of months are both measured on the left axis. The calculations have been made for data between<br />
January 2008 and December 2010.<br />
Source: own calculations using Eurostat data.<br />
FIgURE I.17: Recovery by country in manufacturing output from the trough to March 2011 (%) and<br />
number of months of increasing output in <strong>EU</strong>-27 since the latest crisis<br />
60<br />
50<br />
40<br />
30<br />
20<br />
10<br />
0<br />
EE<br />
SK<br />
LV<br />
BE<br />
LT<br />
DE<br />
BG<br />
CZ<br />
LU<br />
PL<br />
FI<br />
IE<br />
HU<br />
SE<br />
AT<br />
SI<br />
RO<br />
DK <strong>EU</strong>27 <strong>EU</strong>15<br />
IT<br />
NL<br />
MT<br />
FR<br />
PT<br />
UK<br />
RO<br />
ES<br />
NL<br />
Months<br />
T-N<br />
Note: Increase in output and number of months are both measured on the left axis. The calculations have been made for data between<br />
January 2008 and March 2011. N in ‘T‑N’ stands for ‘now’ which in this case means latest available data.<br />
Source: own calculations using Eurostat data.<br />
CY<br />
UK<br />
EL


