Residential Foreclosures in the City of Buffalo, 1990-2000 - Federal ...
Residential Foreclosures in the City of Buffalo, 1990-2000 - Federal ...
Residential Foreclosures in the City of Buffalo, 1990-2000 - Federal ...

You also want an ePaper? Increase the reach of your titles
YUMPU automatically turns print PDFs into web optimized ePapers that Google loves.
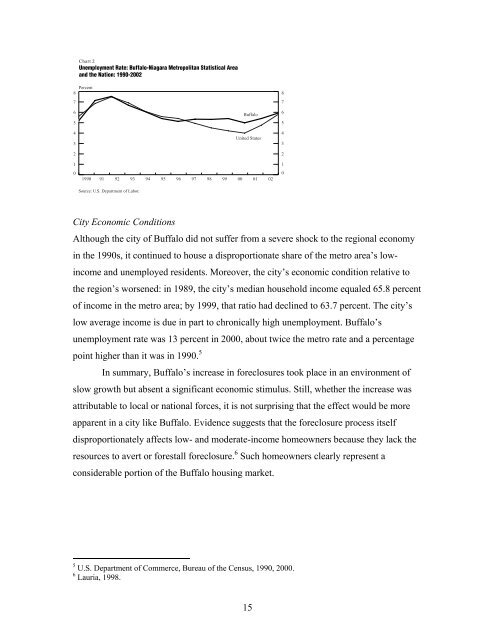
Chart 2<br />
Unemployment Rate: <strong>Buffalo</strong>-Niagara Metropolitan Statistical Area<br />
and <strong>the</strong> Nation: <strong>1990</strong>-2002<br />
Percent<br />
8<br />
7<br />
6<br />
5<br />
4<br />
3<br />
2<br />
1<br />
0<br />
<strong>1990</strong><br />
91<br />
92<br />
93<br />
Source: U.S. Department <strong>of</strong> Labor.<br />
94<br />
95<br />
96<br />
97<br />
98<br />
99<br />
<strong>Buffalo</strong><br />
United States<br />
00<br />
<strong>City</strong> Economic Conditions<br />
Although <strong>the</strong> city <strong>of</strong> <strong>Buffalo</strong> did not suffer from a severe shock to <strong>the</strong> regional economy<br />
<strong>in</strong> <strong>the</strong> <strong>1990</strong>s, it cont<strong>in</strong>ued to house a disproportionate share <strong>of</strong> <strong>the</strong> metro area’s low<strong>in</strong>come<br />
and unemployed residents. Moreover, <strong>the</strong> city’s economic condition relative to<br />
<strong>the</strong> region’s worsened: <strong>in</strong> 1989, <strong>the</strong> city’s median household <strong>in</strong>come equaled 65.8 percent<br />
<strong>of</strong> <strong>in</strong>come <strong>in</strong> <strong>the</strong> metro area; by 1999, that ratio had decl<strong>in</strong>ed to 63.7 percent. The city’s<br />
low average <strong>in</strong>come is due <strong>in</strong> part to chronically high unemployment. <strong>Buffalo</strong>’s<br />
unemployment rate was 13 percent <strong>in</strong> <strong>2000</strong>, about twice <strong>the</strong> metro rate and a percentage<br />
po<strong>in</strong>t higher than it was <strong>in</strong> <strong>1990</strong>. 5<br />
In summary, <strong>Buffalo</strong>’s <strong>in</strong>crease <strong>in</strong> foreclosures took place <strong>in</strong> an environment <strong>of</strong><br />
slow growth but absent a significant economic stimulus. Still, whe<strong>the</strong>r <strong>the</strong> <strong>in</strong>crease was<br />
attributable to local or national forces, it is not surpris<strong>in</strong>g that <strong>the</strong> effect would be more<br />
apparent <strong>in</strong> a city like <strong>Buffalo</strong>. Evidence suggests that <strong>the</strong> foreclosure process itself<br />
disproportionately affects low- and moderate-<strong>in</strong>come homeowners because <strong>the</strong>y lack <strong>the</strong><br />
resources to avert or forestall foreclosure. 6 Such homeowners clearly represent a<br />
considerable portion <strong>of</strong> <strong>the</strong> <strong>Buffalo</strong> hous<strong>in</strong>g market.<br />
5 U.S. Department <strong>of</strong> Commerce, Bureau <strong>of</strong> <strong>the</strong> Census, <strong>1990</strong>, <strong>2000</strong>.<br />
6 Lauria, 1998.<br />
15<br />
01<br />
02<br />
8<br />
7<br />
6<br />
5<br />
4<br />
3<br />
2<br />
1<br />
0