Residential Foreclosures in the City of Buffalo, 1990-2000 - Federal ...
Residential Foreclosures in the City of Buffalo, 1990-2000 - Federal ...
Residential Foreclosures in the City of Buffalo, 1990-2000 - Federal ...

You also want an ePaper? Increase the reach of your titles
YUMPU automatically turns print PDFs into web optimized ePapers that Google loves.
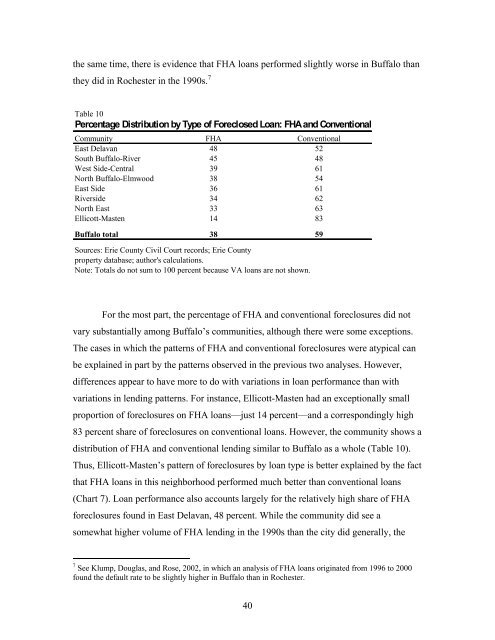
<strong>the</strong> same time, <strong>the</strong>re is evidence that FHA loans performed slightly worse <strong>in</strong> <strong>Buffalo</strong> than<br />
<strong>the</strong>y did <strong>in</strong> Rochester <strong>in</strong> <strong>the</strong> <strong>1990</strong>s. 7<br />
Table 10<br />
Percentage Distribution by Type <strong>of</strong> Foreclosed Loan: FHA and Conventional<br />
Community FHA Conventional<br />
East Delavan 48 52<br />
South <strong>Buffalo</strong>-River 45 48<br />
West Side-Central 39 61<br />
North <strong>Buffalo</strong>-Elmwood 38 54<br />
East Side 36 61<br />
Riverside 34 62<br />
North East 33 63<br />
Ellicott-Masten 14 83<br />
<strong>Buffalo</strong> total 38 59<br />
Sources: Erie County Civil Court records; Erie County<br />
property database; author's calculations.<br />
Note: Totals do not sum to 100 percent because VA loans are not shown.<br />
For <strong>the</strong> most part, <strong>the</strong> percentage <strong>of</strong> FHA and conventional foreclosures did not<br />
vary substantially among <strong>Buffalo</strong>’s communities, although <strong>the</strong>re were some exceptions.<br />
The cases <strong>in</strong> which <strong>the</strong> patterns <strong>of</strong> FHA and conventional foreclosures were atypical can<br />
be expla<strong>in</strong>ed <strong>in</strong> part by <strong>the</strong> patterns observed <strong>in</strong> <strong>the</strong> previous two analyses. However,<br />
differences appear to have more to do with variations <strong>in</strong> loan performance than with<br />
variations <strong>in</strong> lend<strong>in</strong>g patterns. For <strong>in</strong>stance, Ellicott-Masten had an exceptionally small<br />
proportion <strong>of</strong> foreclosures on FHA loans—just 14 percent—and a correspond<strong>in</strong>gly high<br />
83 percent share <strong>of</strong> foreclosures on conventional loans. However, <strong>the</strong> community shows a<br />
distribution <strong>of</strong> FHA and conventional lend<strong>in</strong>g similar to <strong>Buffalo</strong> as a whole (Table 10).<br />
Thus, Ellicott-Masten’s pattern <strong>of</strong> foreclosures by loan type is better expla<strong>in</strong>ed by <strong>the</strong> fact<br />
that FHA loans <strong>in</strong> this neighborhood performed much better than conventional loans<br />
(Chart 7). Loan performance also accounts largely for <strong>the</strong> relatively high share <strong>of</strong> FHA<br />
foreclosures found <strong>in</strong> East Delavan, 48 percent. While <strong>the</strong> community did see a<br />
somewhat higher volume <strong>of</strong> FHA lend<strong>in</strong>g <strong>in</strong> <strong>the</strong> <strong>1990</strong>s than <strong>the</strong> city did generally, <strong>the</strong><br />
7 See Klump, Douglas, and Rose, 2002, <strong>in</strong> which an analysis <strong>of</strong> FHA loans orig<strong>in</strong>ated from 1996 to <strong>2000</strong><br />
found <strong>the</strong> default rate to be slightly higher <strong>in</strong> <strong>Buffalo</strong> than <strong>in</strong> Rochester.<br />
40