Residential Foreclosures in the City of Buffalo, 1990-2000 - Federal ...
Residential Foreclosures in the City of Buffalo, 1990-2000 - Federal ...
Residential Foreclosures in the City of Buffalo, 1990-2000 - Federal ...

You also want an ePaper? Increase the reach of your titles
YUMPU automatically turns print PDFs into web optimized ePapers that Google loves.
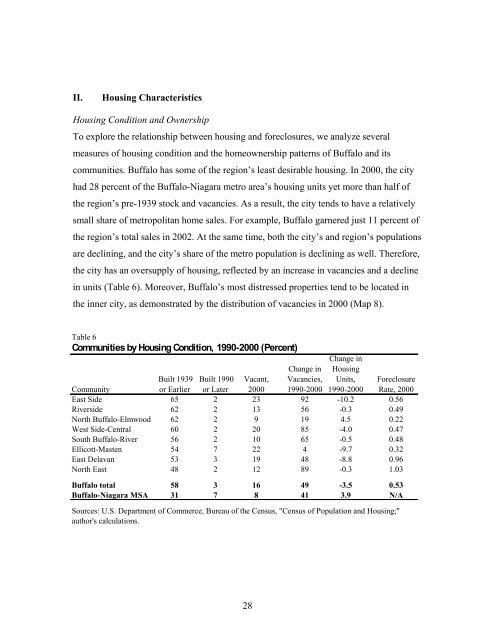
II. Hous<strong>in</strong>g Characteristics<br />
Hous<strong>in</strong>g Condition and Ownership<br />
To explore <strong>the</strong> relationship between hous<strong>in</strong>g and foreclosures, we analyze several<br />
measures <strong>of</strong> hous<strong>in</strong>g condition and <strong>the</strong> homeownership patterns <strong>of</strong> <strong>Buffalo</strong> and its<br />
communities. <strong>Buffalo</strong> has some <strong>of</strong> <strong>the</strong> region’s least desirable hous<strong>in</strong>g. In <strong>2000</strong>, <strong>the</strong> city<br />
had 28 percent <strong>of</strong> <strong>the</strong> <strong>Buffalo</strong>-Niagara metro area’s hous<strong>in</strong>g units yet more than half <strong>of</strong><br />
<strong>the</strong> region’s pre-1939 stock and vacancies. As a result, <strong>the</strong> city tends to have a relatively<br />
small share <strong>of</strong> metropolitan home sales. For example, <strong>Buffalo</strong> garnered just 11 percent <strong>of</strong><br />
<strong>the</strong> region’s total sales <strong>in</strong> 2002. At <strong>the</strong> same time, both <strong>the</strong> city’s and region’s populations<br />
are decl<strong>in</strong><strong>in</strong>g, and <strong>the</strong> city’s share <strong>of</strong> <strong>the</strong> metro population is decl<strong>in</strong><strong>in</strong>g as well. Therefore,<br />
<strong>the</strong> city has an oversupply <strong>of</strong> hous<strong>in</strong>g, reflected by an <strong>in</strong>crease <strong>in</strong> vacancies and a decl<strong>in</strong>e<br />
<strong>in</strong> units (Table 6). Moreover, <strong>Buffalo</strong>’s most distressed properties tend to be located <strong>in</strong><br />
<strong>the</strong> <strong>in</strong>ner city, as demonstrated by <strong>the</strong> distribution <strong>of</strong> vacancies <strong>in</strong> <strong>2000</strong> (Map 8).<br />
Table 6<br />
Communities by Hous<strong>in</strong>g Condition, <strong>1990</strong>-<strong>2000</strong> (Percent)<br />
28<br />
Change <strong>in</strong><br />
Vacancies,<br />
Change <strong>in</strong><br />
Hous<strong>in</strong>g<br />
Units,<br />
Built 1939 Built <strong>1990</strong> Vacant,<br />
Community<br />
or Earlier or Later <strong>2000</strong> <strong>1990</strong>-<strong>2000</strong> <strong>1990</strong>-<strong>2000</strong><br />
East Side 65 2 23 92 -10.2 0.56<br />
Riverside 62 2 13 56 -0.3 0.49<br />
North <strong>Buffalo</strong>-Elmwood 62 2 9 19 4.5 0.22<br />
West Side-Central 60 2 20 85 -4.0 0.47<br />
South <strong>Buffalo</strong>-River 56 2 10 65 -0.5 0.48<br />
Ellicott-Masten 54 7 22 4 -9.7 0.32<br />
East Delavan 53 3 19 48 -8.8 0.96<br />
North East 48 2 12 89 -0.3 1.03<br />
Foreclosure<br />
Rate, <strong>2000</strong><br />
<strong>Buffalo</strong> total 58 3 16 49 -3.5 0.53<br />
<strong>Buffalo</strong>-Niagara MSA 31 7 8 41 3.9 N/A<br />
Sources: U.S. Department <strong>of</strong> Commerce, Bureau <strong>of</strong> <strong>the</strong> Census, "Census <strong>of</strong> Population and Hous<strong>in</strong>g;"<br />
author's calculations.