Residential Foreclosures in the City of Buffalo, 1990-2000 - Federal ...
Residential Foreclosures in the City of Buffalo, 1990-2000 - Federal ...
Residential Foreclosures in the City of Buffalo, 1990-2000 - Federal ...

Create successful ePaper yourself
Turn your PDF publications into a flip-book with our unique Google optimized e-Paper software.
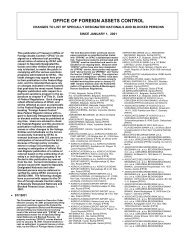
Chart 6 plots <strong>the</strong> trends <strong>in</strong> FHA and conventional lend<strong>in</strong>g <strong>in</strong> <strong>Buffalo</strong> over <strong>the</strong><br />
1992-<strong>2000</strong> period. Interest<strong>in</strong>gly, both types <strong>of</strong> loans followed a pattern <strong>of</strong> growth and<br />
decl<strong>in</strong>e early <strong>in</strong> <strong>the</strong> period, but later <strong>in</strong> <strong>the</strong> decade conventional lend<strong>in</strong>g grew substantially<br />
while FHA lend<strong>in</strong>g leveled <strong>of</strong>f. As we discuss later, a good portion <strong>of</strong> <strong>the</strong> <strong>in</strong>crease <strong>in</strong><br />
conventional lend<strong>in</strong>g was likely attributable to subprime lend<strong>in</strong>g. Over <strong>the</strong> 1992-<strong>2000</strong><br />
period, 23 percent <strong>of</strong> loans made <strong>in</strong> <strong>Buffalo</strong> were FHA loans, while conventional loans<br />
accounted for 77 percent. Nationwide, FHA loans represented about 14 percent <strong>of</strong> all<br />
outstand<strong>in</strong>g mortgages. 6 FHA loans have historically been more prevalent <strong>in</strong> central cities<br />
due to <strong>the</strong> lack <strong>of</strong> conventional prime lend<strong>in</strong>g.<br />
Chart 6<br />
Mortgage Loans Sold <strong>in</strong> <strong>Buffalo</strong>: FHA and Conventional, 1992-<strong>2000</strong><br />
Number<br />
3,500<br />
3,000<br />
2,500<br />
2,000<br />
1,500<br />
1,000<br />
500<br />
0<br />
1992<br />
93<br />
94<br />
95<br />
Sources: <strong>Federal</strong> F<strong>in</strong>ancial Institutions Exam<strong>in</strong>ation Council; Home Mortgage Disclosure Act data.<br />
96<br />
Conventional<br />
97<br />
98<br />
99<br />
FHA<br />
While mortgage lend<strong>in</strong>g grew over <strong>the</strong> 1992-<strong>2000</strong> period, <strong>the</strong> volume <strong>of</strong> lend<strong>in</strong>g<br />
varied throughout <strong>the</strong> city. Chart 7 shows <strong>the</strong> number <strong>of</strong> mortgage loans orig<strong>in</strong>ated from<br />
1992 to <strong>2000</strong> per <strong>the</strong> number <strong>of</strong> occupied hous<strong>in</strong>g units for <strong>the</strong> eight <strong>Buffalo</strong> study areas.<br />
As one might expect, <strong>the</strong> areas demonstrat<strong>in</strong>g high sales activity <strong>in</strong> Table 7 also saw <strong>the</strong><br />
most lend<strong>in</strong>g.<br />
6 U.S. Department <strong>of</strong> Commerce, Bureau <strong>of</strong> <strong>the</strong> Census, 2001, “American Hous<strong>in</strong>g Survey.”<br />
35<br />
00<br />
3,500<br />
3,000<br />
2,500<br />
2,000<br />
1,500<br />
1,000<br />
500<br />
0