
You also want an ePaper? Increase the reach of your titles
YUMPU automatically turns print PDFs into web optimized ePapers that Google loves.
Impact Impact of<br />
of foreign acquisitions<br />
Organic exchange and disposals Reported<br />
growth Percentage Percentage growth<br />
% points points %<br />
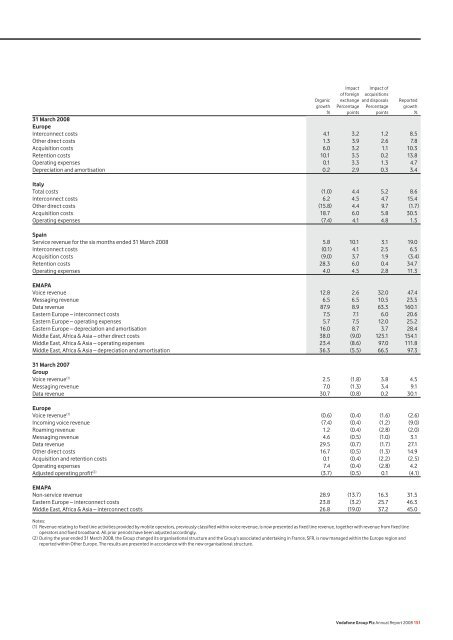
31 March 2008<br />
Europe<br />
Interconnect costs 4.1 3.2 1.2 8.5<br />
O<strong>the</strong>r direct costs 1.3 3.9 2.6 7.8<br />
Acquisition costs 6.0 3.2 1.1 10.3<br />
Retention costs 10.1 3.5 0.2 13.8<br />
Operating expenses 0.1 3.3 1.3 4.7<br />
Depreciation and amortisation 0.2 2.9 0.3 3.4<br />
Italy<br />
Total costs (1.0) 4.4 5.2 8.6<br />
Interconnect costs 6.2 4.5 4.7 15.4<br />
O<strong>the</strong>r direct costs (15.8) 4.4 9.7 (1.7)<br />
Acquisition costs 18.7 6.0 5.8 30.5<br />
Operating expenses (7.4) 4.1 4.8 1.5<br />
Spain<br />
Service revenue for <strong>the</strong> six months ended 31 March 2008 5.8 10.1 3.1 19.0<br />
Interconnect costs (0.1) 4.1 2.5 6.5<br />
Acquisition costs (9.0) 3.7 1.9 (3.4)<br />
Retention costs 28.3 6.0 0.4 34.7<br />
Operating expenses 4.0 4.5 2.8 11.3<br />
EMAPA<br />
Voice revenue 12.8 2.6 32.0 47.4<br />
Messaging revenue 6.5 6.5 10.5 23.5<br />
Data revenue 87.9 8.9 63.3 160.1<br />
Eastern Europe – interconnect costs 7.5 7.1 6.0 20.6<br />
Eastern Europe – operating expenses 5.7 7.5 12.0 25.2<br />
Eastern Europe – depreciation and amortisation 16.0 8.7 3.7 28.4<br />
Middle East, Africa & Asia – o<strong>the</strong>r direct costs 38.0 (9.0) 125.1 154.1<br />
Middle East, Africa & Asia – operating expenses 23.4 (8.6) 97.0 111.8<br />
Middle East, Africa & Asia – depreciation and amortisation 36.3 (5.5) 66.5 97.3<br />
31 March 2007<br />
Group<br />
Voice revenue (1) 2.5 (1.8) 3.8 4.5<br />
Messaging revenue 7.0 (1.3) 3.4 9.1<br />
Data revenue 30.7 (0.8) 0.2 30.1<br />
Europe<br />
Voice revenue (1) (0.6) (0.4) (1.6) (2.6)<br />
Incoming voice revenue (7.4) (0.4) (1.2) (9.0)<br />
Roaming revenue 1.2 (0.4) (2.8) (2.0)<br />
Messaging revenue 4.6 (0.5) (1.0) 3.1<br />
Data revenue 29.5 (0.7) (1.7) 27.1<br />
O<strong>the</strong>r direct costs 16.7 (0.5) (1.3) 14.9<br />
Acquisition and retention costs 0.1 (0.4) (2.2) (2.5)<br />
Operating expenses 7.4 (0.4) (2.8) 4.2<br />
Adjusted operating profit (2) (3.7) (0.5) 0.1 (4.1)<br />
EMAPA<br />
Non-service revenue 28.9 (13.7) 16.3 31.5<br />
Eastern Europe – interconnect costs 23.8 (3.2) 25.7 46.3<br />
Middle East, Africa & Asia – interconnect costs 26.8 (19.0) 37.2 45.0<br />
Notes:<br />
(1) Revenue relating to fixed line activities provided by mobile operators, previously classified within voice revenue, is now presented as fixed line revenue, toge<strong>the</strong>r with revenue from fixed line<br />
operators and fixed broadband. All prior periods have been adjusted accordingly.<br />
(2) During <strong>the</strong> year ended 31 March 2008, <strong>the</strong> Group changed its organisational structure and <strong>the</strong> Group’s associated undertaking in France, SFR, is now managed within <strong>the</strong> Europe region and<br />
<strong>report</strong>ed within O<strong>the</strong>r Europe. The results are presented in accordance with <strong>the</strong> new organisational structure.<br />
<strong>Vodafone</strong> Group Plc Annual Report 2008 151