SAMPLING VEGETATION ATTRIBUTES - New Mexico NRCS - US ...
SAMPLING VEGETATION ATTRIBUTES - New Mexico NRCS - US ...
SAMPLING VEGETATION ATTRIBUTES - New Mexico NRCS - US ...

You also want an ePaper? Increase the reach of your titles
YUMPU automatically turns print PDFs into web optimized ePapers that Google loves.
10<br />
STUDY DESIGN AND ANALYSIS<br />
Macroplot size also depends on the size and shape of the quadrats that will be<br />
used to sample it. The sides of the macroplot should be of dimensions that are<br />
multiples of the sides of the quadrats.<br />
(1) Macroplot layout Pick one corner of the macroplot to serve as the beginning<br />
for sampling purposes. Drive an angle iron location stake into the ground<br />
at this corner. Determine the bearing of the macroplot side that will serve<br />
as the x-axis, run a tape in that direction and put an angle iron stake at the<br />
selected distance. This serves as another corner of the macroplot. Leave<br />
the x-axis tape in place for sampling purposes. Return to the origin and<br />
determine the bearing of the y-axis, which will be perpendicular to the xaxis.<br />
Run a second tape along the y-axis and put an angle iron stake in the<br />
ground at the selected distance. This serves as the third corner of the<br />
macroplot. If desired, a fourth stake may be placed at the remaining<br />
corner, but this is not necessary for sampling since sampling will be done<br />
using the two tapes serving as the x- and y-axes. See Figure 2 for an example.<br />
Leave the tapes in place until the first year’s sampling is completed.<br />
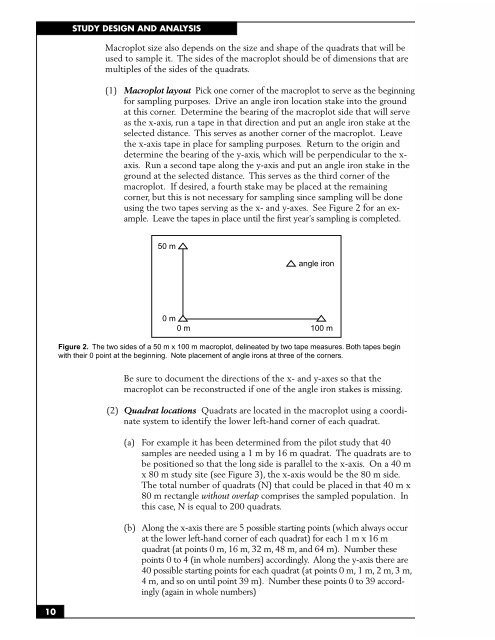
50 m<br />
angle iron<br />
0 m<br />
0 m 100 m<br />
Figure 2. The two sides of a 50 m x 100 m macroplot, delineated by two tape measures. Both tapes begin<br />
with their 0 point at the beginning. Note placement of angle irons at three of the corners.<br />
Be sure to document the directions of the x- and y-axes so that the<br />
macroplot can be reconstructed if one of the angle iron stakes is missing.<br />
(2) Quadrat locations Quadrats are located in the macroplot using a coordinate<br />
system to identify the lower left-hand corner of each quadrat.<br />
(a) For example it has been determined from the pilot study that 40<br />
samples are needed using a 1 m by 16 m quadrat. The quadrats are to<br />
be positioned so that the long side is parallel to the x-axis. On a 40 m<br />
x 80 m study site (see Figure 3), the x-axis would be the 80 m side.<br />
The total number of quadrats (N) that could be placed in that 40 m x<br />
80 m rectangle without overlap comprises the sampled population. In<br />
this case, N is equal to 200 quadrats.<br />
(b) Along the x-axis there are 5 possible starting points (which always occur<br />
at the lower left-hand corner of each quadrat) for each 1 m x 16 m<br />
quadrat (at points 0 m, 16 m, 32 m, 48 m, and 64 m). Number these<br />
points 0 to 4 (in whole numbers) accordingly. Along the y-axis there are<br />
40 possible starting points for each quadrat (at points 0 m, 1 m, 2 m, 3 m,<br />
4 m, and so on until point 39 m). Number these points 0 to 39 accordingly<br />
(again in whole numbers)