SAMPLING VEGETATION ATTRIBUTES - New Mexico NRCS - US ...
SAMPLING VEGETATION ATTRIBUTES - New Mexico NRCS - US ...
SAMPLING VEGETATION ATTRIBUTES - New Mexico NRCS - US ...

You also want an ePaper? Increase the reach of your titles
YUMPU automatically turns print PDFs into web optimized ePapers that Google loves.
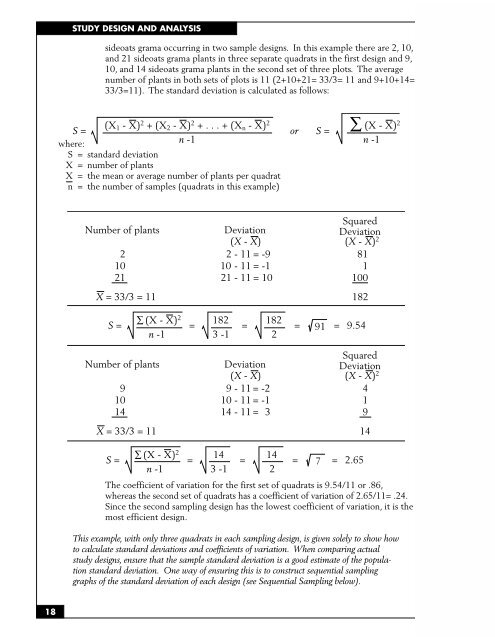
18<br />
STUDY DESIGN AND ANALYSIS<br />
sideoats grama occurring in two sample designs. In this example there are 2, 10,<br />
and 21 sideoats grama plants in three separate quadrats in the first design and 9,<br />
10, and 14 sideoats grama plants in the second set of three plots. The average<br />
number of plants in both sets of plots is 11 (2+10+21= 33/3= 11 and 9+10+14=<br />
33/3=11). The standard deviation is calculated as follows:<br />
(X1 - X)<br />
where:<br />
S = standard deviation<br />
X = number of plants<br />
X = the mean or average number of plants per quadrat<br />
n = the number of samples (quadrats in this example)<br />
2 + (X2 - X) 2 + . . . + (Xn - X) 2 (X - X) 2<br />
S = or S =<br />
n -1<br />
n -1<br />
Number of plants<br />
2<br />
10<br />
21<br />
Deviation<br />
(X - X)<br />
2 - 11 = -9<br />
10 - 11 = -1<br />
21 - 11 = 10<br />
Squared<br />
Deviation<br />
(X - X)<br />
81<br />
1<br />
100<br />
2<br />
X = 33/3 = 11 182<br />
(X - X) 2 182 182<br />
S = = = = 91 = 9.54<br />
n -1 3 -1 2<br />
Number of plants<br />
9<br />
10<br />
14<br />
Deviation<br />
(X - X)<br />
9 - 11 = -2<br />
10 - 11 = -1<br />
14 - 11 = 3<br />
Squared<br />
Deviation<br />
(X - X)<br />
4<br />
1<br />
9<br />
2<br />
X = 33/3 = 11 14<br />
(X - X) 2 14 14<br />
S = = = = 7 = 2.65<br />
n -1 3 -1 2<br />
The coefficient of variation for the first set of quadrats is 9.54/11 or .86,<br />
whereas the second set of quadrats has a coefficient of variation of 2.65/11= .24.<br />
Since the second sampling design has the lowest coefficient of variation, it is the<br />
most efficient design.<br />
This example, with only three quadrats in each sampling design, is given solely to show how<br />
to calculate standard deviations and coefficients of variation. When comparing actual<br />
study designs, ensure that the sample standard deviation is a good estimate of the population<br />
standard deviation. One way of ensuring this is to construct sequential sampling<br />
graphs of the standard deviation of each design (see Sequential Sampling below).