SAMPLING VEGETATION ATTRIBUTES - New Mexico NRCS - US ...
SAMPLING VEGETATION ATTRIBUTES - New Mexico NRCS - US ...
SAMPLING VEGETATION ATTRIBUTES - New Mexico NRCS - US ...

You also want an ePaper? Increase the reach of your titles
YUMPU automatically turns print PDFs into web optimized ePapers that Google loves.
88<br />
METHODS—Cover Board<br />
g Study Documentation Document pertinent information concerning the study<br />
on the Study Location and Documentation Data form (see beginning of Section<br />
III and Appendix A).<br />
7. Taking Photographs The directions for establishing photo plots and for taking<br />
close-up and general view photographs are given in Section V.A.<br />
8. Sampling Process In addition to collecting the specific studies data, general<br />
observations should be made of the study sites (see Section II.F).<br />
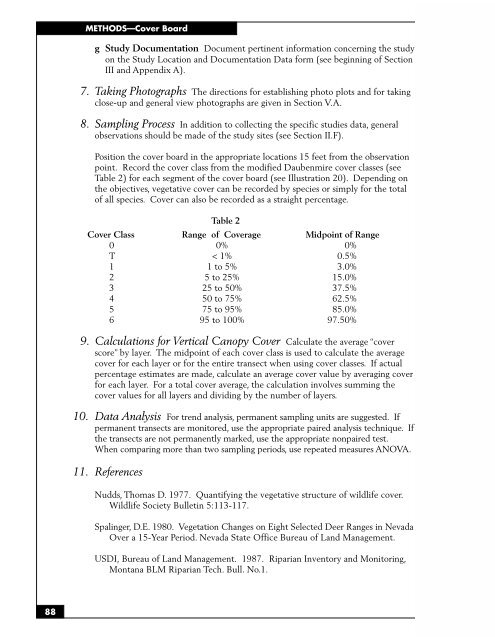
Position the cover board in the appropriate locations 15 feet from the observation<br />
point. Record the cover class from the modified Daubenmire cover classes (see<br />
Table 2) for each segment of the cover board (see Illustration 20). Depending on<br />
the objectives, vegetative cover can be recorded by species or simply for the total<br />
of all species. Cover can also be recorded as a straight percentage.<br />
Cover Class<br />
Table 2<br />
Range of Coverage Midpoint of Range<br />
0 0% 0%<br />
T < 1% 0.5%<br />
1 1 to 5% 3.0%<br />
2 5 to 25% 15.0%<br />
3 25 to 50% 37.5%<br />
4 50 to 75% 62.5%<br />
5 75 to 95% 85.0%<br />
6 95 to 100% 97.50%<br />
9. Calculations for Vertical Canopy Cover Calculate the average “cover<br />
score” by layer. The midpoint of each cover class is used to calculate the average<br />
cover for each layer or for the entire transect when using cover classes. If actual<br />
percentage estimates are made, calculate an average cover value by averaging cover<br />
for each layer. For a total cover average, the calculation involves summing the<br />
cover values for all layers and dividing by the number of layers.<br />
10. Data Analysis For trend analysis, permanent sampling units are suggested. If<br />
permanent transects are monitored, use the appropriate paired analysis technique. If<br />
the transects are not permanently marked, use the appropriate nonpaired test.<br />
When comparing more than two sampling periods, use repeated measures ANOVA.<br />
11. References<br />
Nudds, Thomas D. 1977. Quantifying the vegetative structure of wildlife cover.<br />
Wildlife Society Bulletin 5:113-117.<br />
Spalinger, D.E. 1980. Vegetation Changes on Eight Selected Deer Ranges in Nevada<br />
Over a 15-Year Period. Nevada State Office Bureau of Land Management.<br />
<strong>US</strong>DI, Bureau of Land Management. 1987. Riparian Inventory and Monitoring,<br />
Montana BLM Riparian Tech. Bull. No.1.