electronic warfare self-protection of battlefield helicopters - Aaltodoc
electronic warfare self-protection of battlefield helicopters - Aaltodoc
electronic warfare self-protection of battlefield helicopters - Aaltodoc

Create successful ePaper yourself
Turn your PDF publications into a flip-book with our unique Google optimized e-Paper software.
2.3.4 Traditional methods<br />
37<br />
The expression “traditional methods” refers to the four first methods in Table 1.<br />
Together they are the backbone <strong>of</strong> analyses and communication in most areas <strong>of</strong><br />
science and engineering. It has been claimed that qualitative methodologies generally<br />
produce narrative outputs that are open to a wide array <strong>of</strong> interpretations by readers<br />
and are difficult to represent graphically. The insights produced by qualitative means<br />
are therefore <strong>of</strong>ten difficult to communicate. [Sau02] This view is extreme but not<br />
altogether incorrect, since precise textual information is <strong>of</strong>ten long and demanding<br />
on the reader. However, completed with tables and graphs the written text becomes<br />
more attractive to an audience. One <strong>of</strong> the strengths <strong>of</strong> block and flow diagrams is<br />
the easy way <strong>of</strong> presenting interrelated data and processes.<br />
The only block and flow diagram that has been considered for this study is the<br />
modified data flow diagram (DFD); modified according to the notations in Figure 6.<br />
An example was shown already in Figure 3. The attractiveness <strong>of</strong> this approach is<br />
explained by the fact that data flow diagrams are well known in the engineering<br />
community, they can be used outside their original field <strong>of</strong> s<strong>of</strong>tware systems<br />
engineering, and although the philosophy behind them requires some effort the<br />
diagrams can be understood without training.<br />
Processing delay<br />
Comment:<br />
Templates are used to<br />
highlight entities<br />
within the diagram.<br />
D<br />
TEMPLATE<br />
Processing<br />
task<br />
External<br />
interactor or<br />
resource<br />
Flow<br />
Triggering<br />
flow<br />
Delayed<br />
flow D<br />
Flow with<br />
special<br />
attributes<br />
Store<br />
Miscellaneous<br />
objects<br />
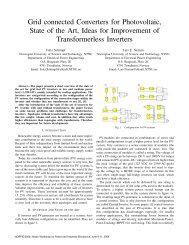
Figure 6: Notations <strong>of</strong> the modified data flow diagram considered for use in the present work.<br />
Whereas the original DFD concentrates on data processes, the modified diagram allows other<br />
factors be modeled as well, and uses annotations for clarity.<br />
2.3.5 Word-and-arrow diagrams<br />
There exists a wealth <strong>of</strong> modeling tools that can be grouped under the heading<br />
“word-and-arrow diagrams”. Word-and-arrow diagrams can be subdivided into<br />
influence diagrams and cognitive maps, although the division is somewhat artificial.<br />
Examples <strong>of</strong> acyclic influence diagrams are the “laundry list” diagram (cf. [Hit92<br />
p.173]) shown in Figure 1, tree diagrams, Ishikawa’s “fish-bone” diagram, and<br />
Bayesian belief networks. The best known cyclic influence diagram is the causal<br />
loop diagram (CLD). A common trait with acyclic influence diagrams is that they<br />
qualitatively depict the influence that various factors (variables, issues, parts, etc.)<br />
have on each other. Cognitive maps show outwardly great similarity with CLDs, and<br />
they have been applied to similar types <strong>of</strong> unstructured problems. Two categories <strong>of</strong><br />
cognitive maps are the Kelly type and the Axelrod type [Axe76, Ede88]. Cognitive