

Download PDF - ChartNexus
Download PDF - ChartNexus
Download PDF - ChartNexus

Create successful ePaper yourself
Turn your PDF publications into a flip-book with our unique Google optimized e-Paper software.
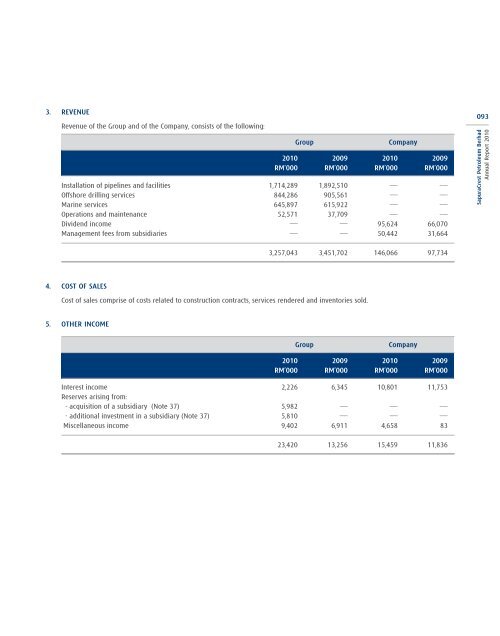
3. Revenue<br />
Revenue of the Group and of the Company, consists of the following:<br />
group Company<br />
2010 2009 2010 2009<br />
Rm’000 Rm’000 Rm’000 Rm’000<br />
Installation of pipelines and facilities 1,714,289 1,892,510 — —<br />
Offshore drilling services 844,286 905,561 — —<br />
Marine services 645,897 615,922 — —<br />
Operations and maintenance 52,571 37,709 — —<br />
Dividend income — — 95,624 66,070<br />
Management fees from subsidiaries — — 50,442 31,664<br />
3,257,043 3,451,702 146,066 97,734<br />
4. CoSt oF SAleS<br />
Cost of sales comprise of costs related to construction contracts, services rendered and inventories sold.<br />
5. otheR inCome<br />
group Company<br />
2010 2009 2010 2009<br />
Rm’000 Rm’000 Rm’000 Rm’000<br />
Interest income 2,226 6,345 10,801 11,753<br />
Reserves arising from:<br />
- acquisition of a subsidiary (Note 37) 5,982 — — —<br />
- additional investment in a subsidiary (Note 37) 5,810 — — —<br />
Miscellaneous income 9,402 6,911 4,658 83<br />
23,420 13,256 15,459 11,836<br />
093<br />
SapuraCrest Petroleum Berhad<br />
Annual Report 2010


