ERCOFTAC Bulletin - Centre Acoustique
ERCOFTAC Bulletin - Centre Acoustique
ERCOFTAC Bulletin - Centre Acoustique

You also want an ePaper? Increase the reach of your titles
YUMPU automatically turns print PDFs into web optimized ePapers that Google loves.
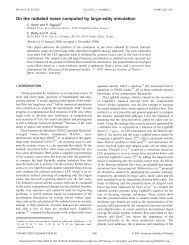
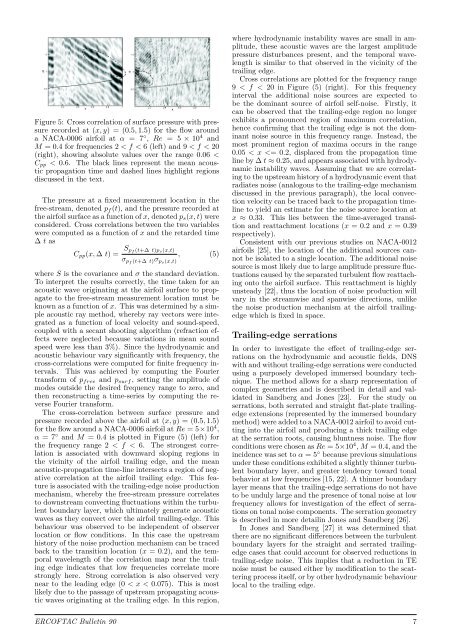
Figure 5: Cross correlation of surface pressure with pressure<br />
recorded at (x, y) = (0.5, 1.5) for the flow around<br />
a NACA-0006 airfoil at α = 7 ◦ , Re = 5 × 10 4 and<br />
M = 0.4 for frequencies 2 < f < 6 (left) and 9 < f < 20<br />
(right), showing absolute values over the range 0.06 <<br />
Cpp < 0.6. The black lines represent the mean acoustic<br />
propagation time and dashed lines highlight regions<br />
discussed in the text.<br />
The pressure at a fixed measurement location in the<br />
free-stream, denoted pf(t), and the pressure recorded at<br />
the airfoil surface as a function of x, denoted ps(x, t) were<br />
considered. Cross correlations between the two variables<br />
were computed as a function of x and the retarded time<br />
∆ t as<br />
Cpp(x, ∆ t) = Spf (t+∆ t)ps(x,t)<br />
, (5)<br />
σpf (t+∆ t)σps(x,t) where S is the covariance and σ the standard deviation.<br />
To interpret the results correctly, the time taken for an<br />
acoustic wave originating at the airfoil surface to propagate<br />
to the free-stream measurement location must be<br />
known as a function of x. This was determined by a simple<br />
acoustic ray method, whereby ray vectors were integrated<br />
as a function of local velocity and sound-speed,<br />
coupled with a secant shooting algorithm (refraction effects<br />
were neglected because variations in mean sound<br />
speed were less than 3%). Since the hydrodynamic and<br />
acoustic behaviour vary significantly with frequency, the<br />
cross-correlations were computed for finite frequency intervals.<br />
This was achieved by computing the Fourier<br />
transform of pfree and psurf, setting the amplitude of<br />
modes outside the desired frequency range to zero, and<br />
then reconstructing a time-series by computing the reverse<br />
Fourier transform.<br />
The cross-correlation between surface pressure and<br />
pressure recorded above the airfoil at (x, y) = (0.5, 1.5)<br />
for the flow around a NACA-0006 airfoil at Re = 5×10 4 ,<br />
α = 7 ◦ and M = 0.4 is plotted in Figure (5) (left) for<br />
the frequency range 2 < f < 6. The strongest correlation<br />
is associated with downward sloping regions in<br />
the vicinity of the airfoil trailing edge, and the mean<br />
acoustic-propagation time-line intersects a region of negative<br />
correlation at the airfoil trailing edge. This feature<br />
is associated with the trailing-edge noise production<br />
mechanism, whereby the free-stream pressure correlates<br />
to downstream convecting fluctuations within the turbulent<br />
boundary layer, which ultimately generate acoustic<br />
waves as they convect over the airfoil trailing-edge. This<br />
behaviour was observed to be independent of observer<br />
location or flow conditions. In this case the upstream<br />
history of the noise production mechanism can be traced<br />
back to the transition location (x = 0.2), and the temporal<br />
wavelength of the correlation map near the trailing<br />
edge indicates that low frequencies correlate more<br />
strongly here. Strong correlation is also observed very<br />
near to the leading edge (0 < x < 0.075). This is most<br />
likely due to the passage of upstream propagating acoustic<br />
waves originating at the trailing edge. In this region,<br />
where hydrodynamic instability waves are small in amplitude,<br />
these acoustic waves are the largest amplitude<br />
pressure disturbances present, and the temporal wavelength<br />
is similar to that observed in the vicinity of the<br />
trailing edge.<br />
Cross correlations are plotted for the frequency range<br />
9 < f < 20 in Figure (5) (right). For this frequency<br />
interval the additional noise sources are expected to<br />
be the dominant source of airfoil self-noise. Firstly, it<br />
can be observed that the trailing-edge region no longer<br />
exhibits a pronounced region of maximum correlation,<br />
hence confirming that the trailing edge is not the dominant<br />
noise source in this frequency range. Instead, the<br />
most prominent region of maxima occurs in the range<br />
0.05 < x