Egypt : Complete Profile - What is GIS - World Health Organization
Egypt : Complete Profile - What is GIS - World Health Organization
Egypt : Complete Profile - What is GIS - World Health Organization

You also want an ePaper? Increase the reach of your titles
YUMPU automatically turns print PDFs into web optimized ePapers that Google loves.
<strong>Health</strong> Systems <strong>Profile</strong>- <strong>Egypt</strong> Regional <strong>Health</strong> Systems Observatory- EMRO<br />
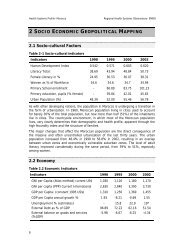
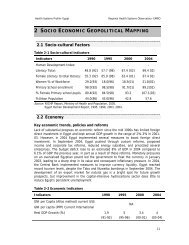
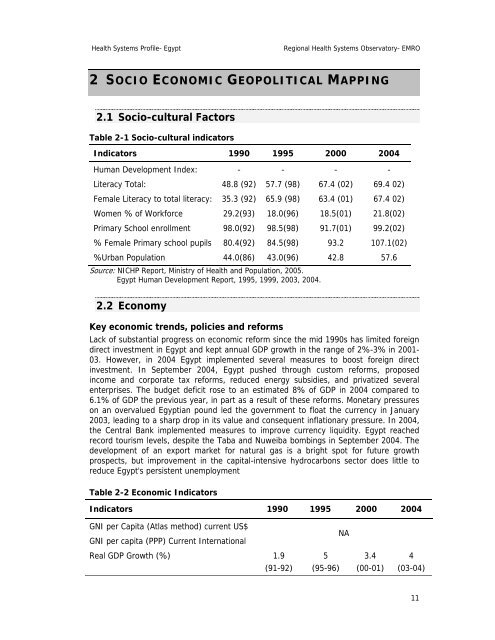
2 SOCIO ECONOMIC GEOPOLITICAL MAPPING<br />
2.1 Socio-cultural Factors<br />
Table 2-1 Socio-cultural indicators<br />
Indicators 1990 1995 2000 2004<br />
Human Development Index: - - - -<br />
Literacy Total: 48.8 (92) 57.7 (98) 67.4 (02) 69.4 02)<br />
Female Literacy to total literacy: 35.3 (92) 65.9 (98) 63.4 (01) 67.4 02)<br />
Women % of Workforce 29.2(93) 18.0(96) 18.5(01) 21.8(02)<br />
Primary School enrollment 98.0(92) 98.5(98) 91.7(01) 99.2(02)<br />
% Female Primary school pupils 80.4(92) 84.5(98) 93.2 107.1(02)<br />
%Urban Population 44.0(86) 43.0(96) 42.8 57.6<br />
Source: NICHP Report, Min<strong>is</strong>try of <strong>Health</strong> and Population, 2005.<br />
<strong>Egypt</strong> Human Development Report, 1995, 1999, 2003, 2004.<br />
2.2 Economy<br />
Key economic trends, policies and reforms<br />
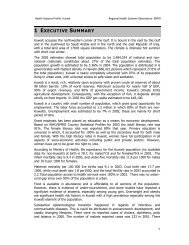
Lack of substantial progress on economic reform since the mid 1990s has limited foreign<br />
direct investment in <strong>Egypt</strong> and kept annual GDP growth in the range of 2%-3% in 2001-<br />
03. However, in 2004 <strong>Egypt</strong> implemented several measures to boost foreign direct<br />
investment. In September 2004, <strong>Egypt</strong> pushed through custom reforms, proposed<br />
income and corporate tax reforms, reduced energy subsidies, and privatized several<br />
enterpr<strong>is</strong>es. The budget deficit rose to an estimated 8% of GDP in 2004 compared to<br />
6.1% of GDP the previous year, in part as a result of these reforms. Monetary pressures<br />
on an overvalued <strong>Egypt</strong>ian pound led the government to float the currency in January<br />
2003, leading to a sharp drop in its value and consequent inflationary pressure. In 2004,<br />
the Central Bank implemented measures to improve currency liquidity. <strong>Egypt</strong> reached<br />
record tour<strong>is</strong>m levels, despite the Taba and Nuweiba bombings in September 2004. The<br />
development of an export market for natural gas <strong>is</strong> a bright spot for future growth<br />
prospects, but improvement in the capital-intensive hydrocarbons sector does little to<br />
reduce <strong>Egypt</strong>'s pers<strong>is</strong>tent unemployment<br />
Table 2-2 Economic Indicators<br />
Indicators 1990 1995 2000 2004<br />
GNI per Capita (Atlas method) current US$<br />
GNI per capita (PPP) Current International<br />
Real GDP Growth (%) 1.9<br />
(91-92)<br />
5<br />
(95-96)<br />
NA<br />
3.4<br />
(00-01)<br />
4<br />
(03-04)<br />
11