Progressively Interactive Evolutionary Multi-Objective Optimization ...
Progressively Interactive Evolutionary Multi-Objective Optimization ...
Progressively Interactive Evolutionary Multi-Objective Optimization ...

Create successful ePaper yourself
Turn your PDF publications into a flip-book with our unique Google optimized e-Paper software.
LL Function Evals.<br />
UL Function Evals.<br />
380000<br />
340000<br />
300000<br />
260000<br />
100<br />
22000<br />
20000<br />
18000<br />
16000<br />
100<br />
300<br />
300<br />
500<br />
Population Size<br />
500<br />
Population Size<br />
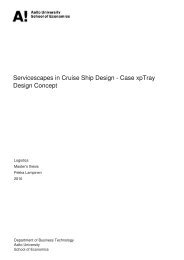
Figure 16: Average lower and upper level function evaluations with different populationsizesforproblemTP2indicates<br />
Nu = 300isthebestchoice. 21runs areperformed<br />
ineachcase.<br />
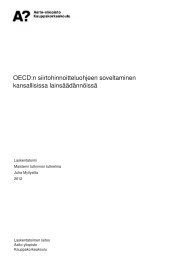
tives. This multi-objective bilevel problem was solved in the original study (Zhang<br />
et al., 2007) by converting two objectives into a single objective by the weighted-sum<br />
approach. The reportedsolution is marked on the figure with a star. It is interesting to<br />
note thatthissolution is oneoftheextremesolutions ofour obtainedfront. For aproblem<br />
having a linear Pareto-optimal front, the solution of a weighted-sum optimization<br />
approach is usually one of the extreme points. To this account, this result signifies the<br />
accuracyand efficiencyofthe H-BLEMOprocedure.<br />
F2<br />
−1550<br />
−1600<br />
−1650<br />
−1700<br />
−1750<br />
−1800<br />
−1850<br />
−1900<br />
−600 −580 −560 −540 −520 −500 −480 −460<br />
F1<br />
Figure 17: Final archive solutions for<br />
problem TP4. The point marked with a<br />
staris takenfromZhang etal. (2007).<br />
F2<br />
−1550<br />
−1600<br />
−1650<br />
−1700<br />
−1750<br />
−1800<br />
−1850<br />
800<br />
800<br />
−1900<br />
−600 −580 −560 −540 −520 −500 −480 −460<br />
F1<br />
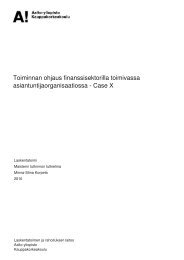
Figure 18: Attainment surfaces(0%, 50%<br />
and100%)forproblemTP4from21runs.<br />
Figure 18 shows three attainment surface plots which are close to each other, like<br />
they arein the previous two problems. The hypervolumes for the obtained attainment<br />
surfaces are 0.5239, 0.5255 and 0.5260, with a maximum difference of 0.4% only, indi-<br />
100