GM Crops: The First Ten Years - International Service for the ...
GM Crops: The First Ten Years - International Service for the ...
GM Crops: The First Ten Years - International Service for the ...

You also want an ePaper? Increase the reach of your titles
YUMPU automatically turns print PDFs into web optimized ePapers that Google loves.
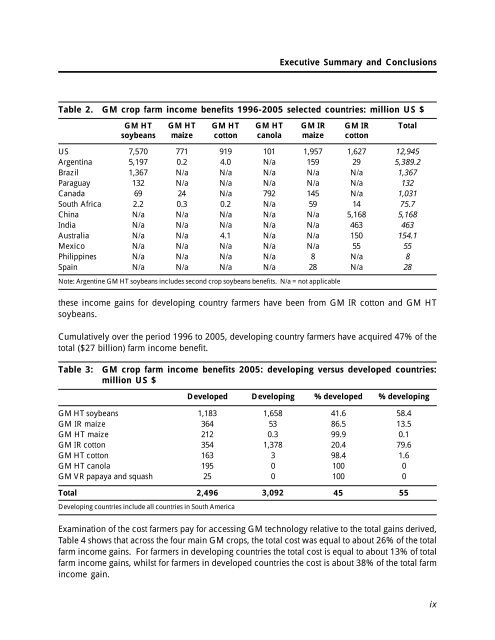
Table 2. <strong>GM</strong> crop farm income benefits 1996-2005 selected countries: million US $<br />
US<br />
Argentina<br />
Brazil<br />
Paraguay<br />
Canada<br />
South Africa<br />
China<br />
India<br />
Australia<br />
Mexico<br />
Philippines<br />
Spain<br />
<strong>GM</strong> HT<br />
soybeans<br />
7,570<br />
5,197<br />
1,367<br />
132<br />
69<br />
2.2<br />
N/a<br />
N/a<br />
N/a<br />
N/a<br />
N/a<br />
N/a<br />
<strong>GM</strong> HT<br />
maize<br />
771<br />
0.2<br />
N/a<br />
N/a<br />
24<br />
0.3<br />
N/a<br />
N/a<br />
N/a<br />
N/a<br />
N/a<br />
N/a<br />
<strong>GM</strong> HT<br />
cotton<br />
919<br />
4.0<br />
N/a<br />
N/a<br />
N/a<br />
0.2<br />
N/a<br />
N/a<br />
4.1<br />
N/a<br />
N/a<br />
N/a<br />
<strong>GM</strong> HT<br />
canola<br />
101<br />
N/a<br />
N/a<br />
N/a<br />
792<br />
N/a<br />
N/a<br />
N/a<br />
N/a<br />
N/a<br />
N/a<br />
N/a<br />
<strong>GM</strong> IR<br />
maize<br />
1,957<br />
159<br />
N/a<br />
N/a<br />
145<br />
59<br />
N/a<br />
N/a<br />
N/a<br />
N/a<br />
8<br />
28<br />
Note: Argentine <strong>GM</strong> HT soybeans includes second crop soybeans benefits. N/a = not applicable<br />
<strong>GM</strong> IR<br />
cotton<br />
1,627<br />
29<br />
N/a<br />
N/a<br />
N/a<br />
14<br />
5,168<br />
463<br />
150<br />
55<br />
N/a<br />
N/a<br />
Total<br />
12,945<br />
5,389.2<br />
1,367<br />
132<br />
1,031<br />
75.7<br />
5,168<br />
463<br />
154.1<br />
55<br />
8<br />
28<br />
Table 3: <strong>GM</strong> crop farm income benefits 2005: developing versus developed countries:<br />
million US $<br />
<strong>GM</strong> HT soybeans<br />
<strong>GM</strong> IR maize<br />
<strong>GM</strong> HT maize<br />
<strong>GM</strong> IR cotton<br />
<strong>GM</strong> HT cotton<br />
<strong>GM</strong> HT canola<br />
<strong>GM</strong> VR papaya and squash<br />
Developed<br />
1,183<br />
364<br />
212<br />
354<br />
163<br />
195<br />
25<br />
Developing countries include all countries in South America<br />
Developing % developed % developing<br />
1,658<br />
53<br />
0.3<br />
1,378<br />
3<br />
0<br />
0<br />
Executive Summary and Conclusions<br />
<strong>the</strong>se income gains <strong>for</strong> developing country farmers have been from <strong>GM</strong> IR cotton and <strong>GM</strong> HT<br />
soybeans.<br />
Cumulatively over <strong>the</strong> period 1996 to 2005, developing country farmers have acquired 47% of <strong>the</strong><br />
total ($27 billion) farm income benefit.<br />
41.6<br />
86.5<br />
99.9<br />
20.4<br />
98.4<br />
100<br />
100<br />
Total 2,496 3,092<br />
45<br />
55<br />
Examination of <strong>the</strong> cost farmers pay <strong>for</strong> accessing <strong>GM</strong> technology relative to <strong>the</strong> total gains derived,<br />
Table 4 shows that across <strong>the</strong> four main <strong>GM</strong> crops, <strong>the</strong> total cost was equal to about 26% of <strong>the</strong> total<br />
farm income gains. For farmers in developing countries <strong>the</strong> total cost is equal to about 13% of total<br />
farm income gains, whilst <strong>for</strong> farmers in developed countries <strong>the</strong> cost is about 38% of <strong>the</strong> total farm<br />
income gain.<br />
58.4<br />
13.5<br />
0.1<br />
79.6<br />
1.6<br />
0<br />
0<br />
ix