GM Crops: The First Ten Years - International Service for the ...
GM Crops: The First Ten Years - International Service for the ...
GM Crops: The First Ten Years - International Service for the ...

Create successful ePaper yourself
Turn your PDF publications into a flip-book with our unique Google optimized e-Paper software.
<strong>GM</strong> <strong>Crops</strong>: <strong>The</strong> <strong>First</strong> <strong>Ten</strong> <strong>Years</strong><br />
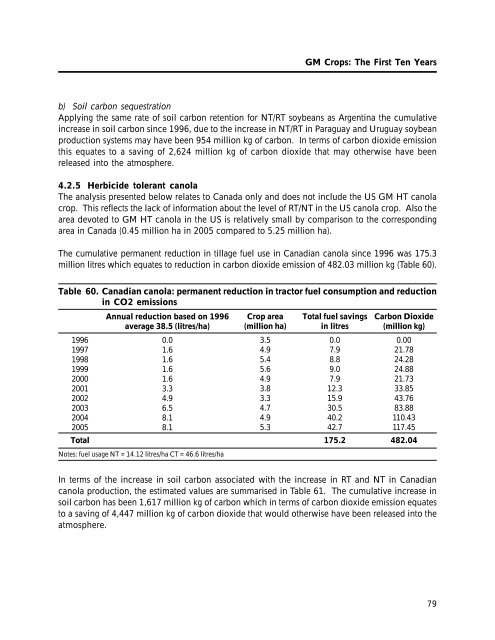
b) Soil carbon sequestration<br />
Applying <strong>the</strong> same rate of soil carbon retention <strong>for</strong> NT/RT soybeans as Argentina <strong>the</strong> cumulative<br />
increase in soil carbon since 1996, due to <strong>the</strong> increase in NT/RT in Paraguay and Uruguay soybean<br />
production systems may have been 954 million kg of carbon. In terms of carbon dioxide emission<br />
this equates to a saving of 2,624 million kg of carbon dioxide that may o<strong>the</strong>rwise have been<br />
released into <strong>the</strong> atmosphere.<br />
4.2.5 Herbicide tolerant canola<br />
<strong>The</strong> analysis presented below relates to Canada only and does not include <strong>the</strong> US <strong>GM</strong> HT canola<br />
crop. This reflects <strong>the</strong> lack of in<strong>for</strong>mation about <strong>the</strong> level of RT/NT in <strong>the</strong> US canola crop. Also <strong>the</strong><br />
area devoted to <strong>GM</strong> HT canola in <strong>the</strong> US is relatively small by comparison to <strong>the</strong> corresponding<br />
area in Canada (0.45 million ha in 2005 compared to 5.25 million ha).<br />
<strong>The</strong> cumulative permanent reduction in tillage fuel use in Canadian canola since 1996 was 175.3<br />
million litres which equates to reduction in carbon dioxide emission of 482.03 million kg (Table 60).<br />
Table 60. Canadian canola: permanent reduction in tractor fuel consumption and reduction<br />
in CO2 emissions<br />
1996<br />
1997<br />
1998<br />
1999<br />
2000<br />
2001<br />
2002<br />
2003<br />
2004<br />
2005<br />
Annual reduction based on 1996<br />
average 38.5 (litres/ha)<br />
0.0<br />
1.6<br />
1.6<br />
1.6<br />
1.6<br />
3.3<br />
4.9<br />
6.5<br />
8.1<br />
8.1<br />
Crop area<br />
(million ha)<br />
3.5<br />
4.9<br />
5.4<br />
5.6<br />
4.9<br />
3.8<br />
3.3<br />
4.7<br />
4.9<br />
5.3<br />
Total fuel savings<br />
in litres<br />
0.0<br />
7.9<br />
8.8<br />
9.0<br />
7.9<br />
12.3<br />
15.9<br />
30.5<br />
40.2<br />
42.7<br />
Carbon Dioxide<br />
(million kg)<br />
0.00<br />
21.78<br />
24.28<br />
24.88<br />
21.73<br />
33.85<br />
43.76<br />
83.88<br />
110.43<br />
117.45<br />
Total 175.2 482.04<br />
Notes: fuel usage NT = 14.12 litres/ha CT = 46.6 litres/ha<br />
In terms of <strong>the</strong> increase in soil carbon associated with <strong>the</strong> increase in RT and NT in Canadian<br />
canola production, <strong>the</strong> estimated values are summarised in Table 61. <strong>The</strong> cumulative increase in<br />
soil carbon has been 1,617 million kg of carbon which in terms of carbon dioxide emission equates<br />
to a saving of 4,447 million kg of carbon dioxide that would o<strong>the</strong>rwise have been released into <strong>the</strong><br />
atmosphere.<br />
79