GM Crops: The First Ten Years - International Service for the ...
GM Crops: The First Ten Years - International Service for the ...
GM Crops: The First Ten Years - International Service for the ...

You also want an ePaper? Increase the reach of your titles
YUMPU automatically turns print PDFs into web optimized ePapers that Google loves.
<strong>GM</strong> <strong>Crops</strong>: <strong>The</strong> <strong>First</strong> <strong>Ten</strong> <strong>Years</strong><br />
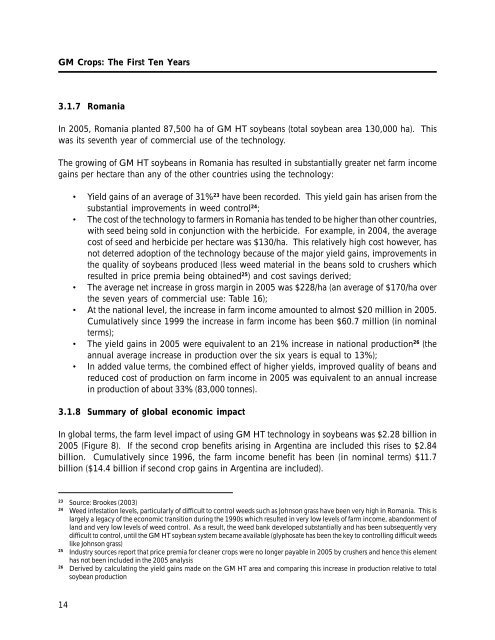
3.1.7 Romania<br />
In 2005, Romania planted 87,500 ha of <strong>GM</strong> HT soybeans (total soybean area 130,000 ha). This<br />
was its seventh year of commercial use of <strong>the</strong> technology.<br />
<strong>The</strong> growing of <strong>GM</strong> HT soybeans in Romania has resulted in substantially greater net farm income<br />
gains per hectare than any of <strong>the</strong> o<strong>the</strong>r countries using <strong>the</strong> technology:<br />
• Yield gains of an average of 31% 23 have been recorded. This yield gain has arisen from <strong>the</strong><br />
substantial improvements in weed control 24 ;<br />
• <strong>The</strong> cost of <strong>the</strong> technology to farmers in Romania has tended to be higher than o<strong>the</strong>r countries,<br />
with seed being sold in conjunction with <strong>the</strong> herbicide. For example, in 2004, <strong>the</strong> average<br />
cost of seed and herbicide per hectare was $130/ha. This relatively high cost however, has<br />
not deterred adoption of <strong>the</strong> technology because of <strong>the</strong> major yield gains, improvements in<br />
<strong>the</strong> quality of soybeans produced (less weed material in <strong>the</strong> beans sold to crushers which<br />
resulted in price premia being obtained 25 ) and cost savings derived;<br />
• <strong>The</strong> average net increase in gross margin in 2005 was $228/ha (an average of $170/ha over<br />
<strong>the</strong> seven years of commercial use: Table 16);<br />
• At <strong>the</strong> national level, <strong>the</strong> increase in farm income amounted to almost $20 million in 2005.<br />
Cumulatively since 1999 <strong>the</strong> increase in farm income has been $60.7 million (in nominal<br />
terms);<br />
• <strong>The</strong> yield gains in 2005 were equivalent to an 21% increase in national production 26 (<strong>the</strong><br />
annual average increase in production over <strong>the</strong> six years is equal to 13%);<br />
• In added value terms, <strong>the</strong> combined effect of higher yields, improved quality of beans and<br />
reduced cost of production on farm income in 2005 was equivalent to an annual increase<br />
in production of about 33% (83,000 tonnes).<br />
3.1.8 Summary of global economic impact<br />
In global terms, <strong>the</strong> farm level impact of using <strong>GM</strong> HT technology in soybeans was $2.28 billion in<br />
2005 (Figure 8). If <strong>the</strong> second crop benefits arising in Argentina are included this rises to $2.84<br />
billion. Cumulatively since 1996, <strong>the</strong> farm income benefit has been (in nominal terms) $11.7<br />
billion ($14.4 billion if second crop gains in Argentina are included).<br />
23 Source: Brookes (2003)<br />
24 Weed infestation levels, particularly of difficult to control weeds such as Johnson grass have been very high in Romania. This is<br />
largely a legacy of <strong>the</strong> economic transition during <strong>the</strong> 1990s which resulted in very low levels of farm income, abandonment of<br />
land and very low levels of weed control. As a result, <strong>the</strong> weed bank developed substantially and has been subsequently very<br />
difficult to control, until <strong>the</strong> <strong>GM</strong> HT soybean system became available (glyphosate has been <strong>the</strong> key to controlling difficult weeds<br />
like Johnson grass)<br />
25 Industry sources report that price premia <strong>for</strong> cleaner crops were no longer payable in 2005 by crushers and hence this element<br />
has not been included in <strong>the</strong> 2005 analysis<br />
26 Derived by calculating <strong>the</strong> yield gains made on <strong>the</strong> <strong>GM</strong> HT area and comparing this increase in production relative to total<br />
soybean production<br />
14