GM Crops: The First Ten Years - International Service for the ...
GM Crops: The First Ten Years - International Service for the ...
GM Crops: The First Ten Years - International Service for the ...

Create successful ePaper yourself
Turn your PDF publications into a flip-book with our unique Google optimized e-Paper software.
<strong>GM</strong> <strong>Crops</strong>: <strong>The</strong> <strong>First</strong> <strong>Ten</strong> <strong>Years</strong><br />
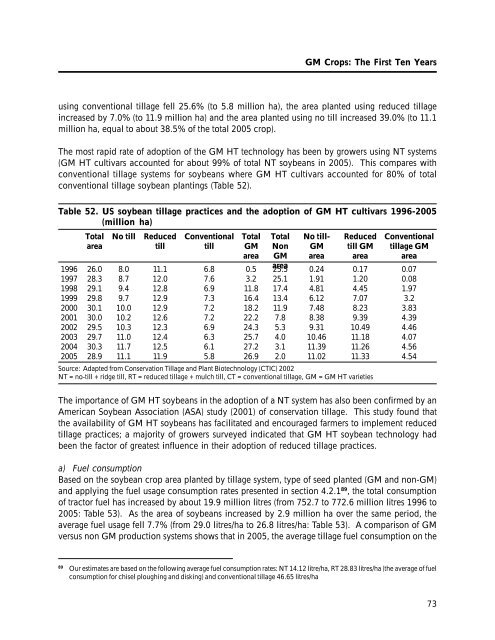
using conventional tillage fell 25.6% (to 5.8 million ha), <strong>the</strong> area planted using reduced tillage<br />
increased by 7.0% (to 11.9 million ha) and <strong>the</strong> area planted using no till increased 39.0% (to 11.1<br />
million ha, equal to about 38.5% of <strong>the</strong> total 2005 crop).<br />
<strong>The</strong> most rapid rate of adoption of <strong>the</strong> <strong>GM</strong> HT technology has been by growers using NT systems<br />
(<strong>GM</strong> HT cultivars accounted <strong>for</strong> about 99% of total NT soybeans in 2005). This compares with<br />
conventional tillage systems <strong>for</strong> soybeans where <strong>GM</strong> HT cultivars accounted <strong>for</strong> 80% of total<br />
conventional tillage soybean plantings (Table 52).<br />
Table 52. US soybean tillage practices and <strong>the</strong> adoption of <strong>GM</strong> HT cultivars 1996-2005<br />
(million ha)<br />
1996<br />
1997<br />
1998<br />
1999<br />
2000<br />
2001<br />
2002<br />
2003<br />
2004<br />
2005<br />
Total<br />
area<br />
26.0<br />
28.3<br />
29.1<br />
29.8<br />
30.1<br />
30.0<br />
29.5<br />
29.7<br />
30.3<br />
28.9<br />
No till<br />
8.0<br />
8.7<br />
9.4<br />
9.7<br />
10.0<br />
10.2<br />
10.3<br />
11.0<br />
11.7<br />
11.1<br />
Reduced<br />
till<br />
11.1<br />
12.0<br />
12.8<br />
12.9<br />
12.9<br />
12.6<br />
12.3<br />
12.4<br />
12.5<br />
11.9<br />
Conventional<br />
till<br />
6.8<br />
7.6<br />
6.9<br />
7.3<br />
7.2<br />
7.2<br />
6.9<br />
6.3<br />
6.1<br />
5.8<br />
Total<br />
<strong>GM</strong><br />
area<br />
0.5<br />
3.2<br />
11.8<br />
16.4<br />
18.2<br />
22.2<br />
24.3<br />
25.7<br />
27.2<br />
26.9<br />
Total<br />
Non<br />
<strong>GM</strong><br />
area<br />
25.5<br />
25.1<br />
17.4<br />
13.4<br />
11.9<br />
7.8<br />
5.3<br />
4.0<br />
3.1<br />
2.0<br />
No till-<br />
<strong>GM</strong><br />
area<br />
0.24<br />
1.91<br />
4.81<br />
6.12<br />
7.48<br />
8.38<br />
9.31<br />
10.46<br />
11.39<br />
11.02<br />
Reduced<br />
till <strong>GM</strong><br />
area<br />
0.17<br />
1.20<br />
4.45<br />
7.07<br />
8.23<br />
9.39<br />
10.49<br />
11.18<br />
11.26<br />
11.33<br />
Source: Adapted from Conservation Tillage and Plant Biotechnology (CTIC) 2002<br />
NT = no-till + ridge till, RT = reduced tillage + mulch till, CT = conventional tillage, <strong>GM</strong> = <strong>GM</strong> HT varieties<br />
Conventional<br />
tillage <strong>GM</strong><br />
area<br />
0.07<br />
0.08<br />
1.97<br />
3.2<br />
3.83<br />
4.39<br />
4.46<br />
4.07<br />
4.56<br />
4.54<br />
<strong>The</strong> importance of <strong>GM</strong> HT soybeans in <strong>the</strong> adoption of a NT system has also been confirmed by an<br />
American Soybean Association (ASA) study (2001) of conservation tillage. This study found that<br />
<strong>the</strong> availability of <strong>GM</strong> HT soybeans has facilitated and encouraged farmers to implement reduced<br />
tillage practices; a majority of growers surveyed indicated that <strong>GM</strong> HT soybean technology had<br />
been <strong>the</strong> factor of greatest influence in <strong>the</strong>ir adoption of reduced tillage practices.<br />
a) Fuel consumption<br />
Based on <strong>the</strong> soybean crop area planted by tillage system, type of seed planted (<strong>GM</strong> and non-<strong>GM</strong>)<br />
and applying <strong>the</strong> fuel usage consumption rates presented in section 4.2.1 89 , <strong>the</strong> total consumption<br />
of tractor fuel has increased by about 19.9 million litres (from 752.7 to 772.6 million litres 1996 to<br />
2005: Table 53). As <strong>the</strong> area of soybeans increased by 2.9 million ha over <strong>the</strong> same period, <strong>the</strong><br />
average fuel usage fell 7.7% (from 29.0 litres/ha to 26.8 litres/ha: Table 53). A comparison of <strong>GM</strong><br />
versus non <strong>GM</strong> production systems shows that in 2005, <strong>the</strong> average tillage fuel consumption on <strong>the</strong><br />
89 Our estimates are based on <strong>the</strong> following average fuel consumption rates: NT 14.12 litre/ha, RT 28.83 litres/ha (<strong>the</strong> average of fuel<br />
consumption <strong>for</strong> chisel ploughing and disking) and conventional tillage 46.65 litres/ha<br />
73