GM Crops: The First Ten Years - International Service for the ...
GM Crops: The First Ten Years - International Service for the ...
GM Crops: The First Ten Years - International Service for the ...

Create successful ePaper yourself
Turn your PDF publications into a flip-book with our unique Google optimized e-Paper software.
<strong>GM</strong> <strong>Crops</strong>: <strong>The</strong> <strong>First</strong> <strong>Ten</strong> <strong>Years</strong><br />
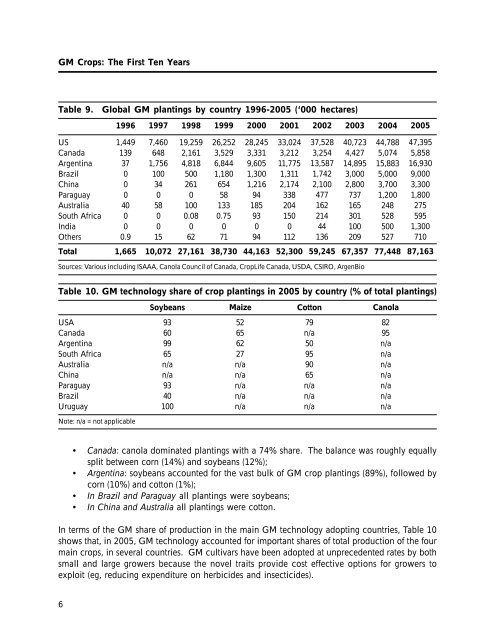
Table 9. Global <strong>GM</strong> plantings by country 1996-2005 (‘000 hectares)<br />
US<br />
Canada<br />
Argentina<br />
Brazil<br />
China<br />
Paraguay<br />
Australia<br />
South Africa<br />
India<br />
O<strong>the</strong>rs<br />
1996<br />
1,449<br />
139<br />
37<br />
0<br />
0<br />
0<br />
40<br />
0<br />
0<br />
0.9<br />
1997 1998 1999 2000 2001<br />
7,460<br />
648<br />
1,756<br />
100<br />
34<br />
0<br />
58<br />
0<br />
0<br />
15<br />
19,259<br />
2,161<br />
4,818<br />
500<br />
261<br />
0<br />
100<br />
0.08<br />
0<br />
62<br />
26,252<br />
3,529<br />
6,844<br />
1,180<br />
654<br />
58<br />
133<br />
0.75<br />
0<br />
71<br />
28,245<br />
3,331<br />
9,605<br />
1,300<br />
1,216<br />
94<br />
185<br />
93<br />
0<br />
94<br />
33,024<br />
3,212<br />
11,775<br />
1,311<br />
2,174<br />
338<br />
204<br />
150<br />
0<br />
112<br />
2002<br />
37,528<br />
3,254<br />
13,587<br />
1,742<br />
2,100<br />
477<br />
162<br />
214<br />
44<br />
136<br />
Sources: Various including ISAAA, Canola Council of Canada, CropLife Canada, USDA, CSIRO, ArgenBio<br />
2003 2004<br />
40,723<br />
4,427<br />
14,895<br />
3,000<br />
2,800<br />
737<br />
165<br />
301<br />
100<br />
209<br />
44,788<br />
5,074<br />
15,883<br />
5,000<br />
3,700<br />
1,200<br />
248<br />
528<br />
500<br />
527<br />
2005<br />
47,395<br />
5,858<br />
16,930<br />
9,000<br />
3,300<br />
1,800<br />
275<br />
595<br />
1,300<br />
710<br />
Total 1,665 10,072 27,161 38,730 44,163 52,300 59,245 67,357 77,448 87,163<br />
Table 10. <strong>GM</strong> technology share of crop plantings in 2005 by country (% of total plantings)<br />
USA<br />
Canada<br />
Argentina<br />
South Africa<br />
Australia<br />
China<br />
Paraguay<br />
Brazil<br />
Uruguay<br />
Note: n/a = not applicable<br />
Soybeans<br />
93<br />
60<br />
99<br />
65<br />
n/a<br />
n/a<br />
93<br />
40<br />
100<br />
Maize Cotton Canola<br />
52<br />
65<br />
62<br />
27<br />
n/a<br />
n/a<br />
n/a<br />
n/a<br />
n/a<br />
• Canada: canola dominated plantings with a 74% share. <strong>The</strong> balance was roughly equally<br />
split between corn (14%) and soybeans (12%);<br />
• Argentina: soybeans accounted <strong>for</strong> <strong>the</strong> vast bulk of <strong>GM</strong> crop plantings (89%), followed by<br />
corn (10%) and cotton (1%);<br />
• In Brazil and Paraguay all plantings were soybeans;<br />
• In China and Australia all plantings were cotton.<br />
In terms of <strong>the</strong> <strong>GM</strong> share of production in <strong>the</strong> main <strong>GM</strong> technology adopting countries, Table 10<br />
shows that, in 2005, <strong>GM</strong> technology accounted <strong>for</strong> important shares of total production of <strong>the</strong> four<br />
main crops, in several countries. <strong>GM</strong> cultivars have been adopted at unprecedented rates by both<br />
small and large growers because <strong>the</strong> novel traits provide cost effective options <strong>for</strong> growers to<br />
exploit (eg, reducing expenditure on herbicides and insecticides).<br />
6<br />
79<br />
n/a<br />
50<br />
95<br />
90<br />
65<br />
n/a<br />
n/a<br />
n/a<br />
82<br />
95<br />
n/a<br />
n/a<br />
n/a<br />
n/a<br />
n/a<br />
n/a<br />
n/a