

Hyperbare Zuurstoftherapie: Rapid Assessment - KCE
Hyperbare Zuurstoftherapie: Rapid Assessment - KCE
Hyperbare Zuurstoftherapie: Rapid Assessment - KCE

Create successful ePaper yourself
Turn your PDF publications into a flip-book with our unique Google optimized e-Paper software.
<strong>KCE</strong> Reports 74 Hyperbaric Oxygenation Therapy 45<br />
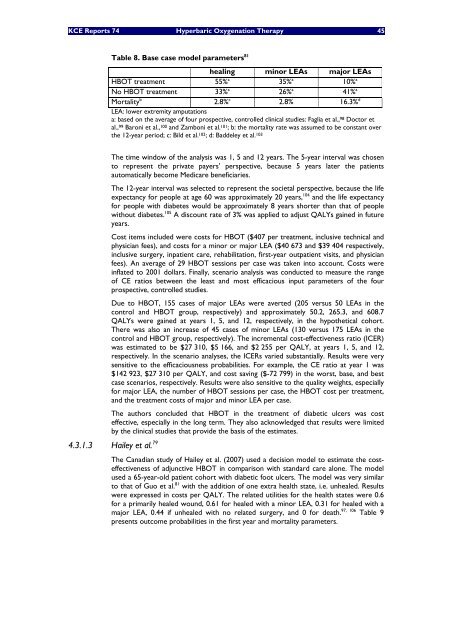
Table 8. Base case model parameters 81<br />
healing minor LEAs major LEAs<br />
HBOT treatment 55% a 35% a 10% a<br />
No HBOT treatment 33% a 26% a 41% a<br />
Mortality b 2.8% c 2.8% 16.3% d<br />
LEA: lower extremity amputations<br />
a: based on the average of four prospective, controlled clinical studies: Faglia et al., 98 Doctor et<br />
al., 99 Baroni et al., 100 and Zamboni et al. 101; b: the mortality rate was assumed to be constant over<br />
the 12-year period; c: Bild et al. 102; d: Baddeley et al. 103<br />
The time window of the analysis was 1, 5 and 12 years. The 5-year interval was chosen<br />
to represent the private payers’ perspective, because 5 years later the patients<br />
automatically become Medicare beneficiaries.<br />
The 12-year interval was selected to represent the societal perspective, because the life<br />
expectancy for people at age 60 was approximately 20 years, 104 and the life expectancy<br />
for people with diabetes would be approximately 8 years shorter than that of people<br />
without diabetes. 105 A discount rate of 3% was applied to adjust QALYs gained in future<br />
years.<br />
Cost items included were costs for HBOT ($407 per treatment, inclusive technical and<br />
physician fees), and costs for a minor or major LEA ($40 673 and $39 404 respectively,<br />
inclusive surgery, inpatient care, rehabilitation, first-year outpatient visits, and physician<br />
fees). An average of 29 HBOT sessions per case was taken into account. Costs were<br />
inflated to 2001 dollars. Finally, scenario analysis was conducted to measure the range<br />
of CE ratios between the least and most efficacious input parameters of the four<br />
prospective, controlled studies.<br />
Due to HBOT, 155 cases of major LEAs were averted (205 versus 50 LEAs in the<br />
control and HBOT group, respectively) and approximately 50.2, 265.3, and 608.7<br />
QALYs were gained at years 1, 5, and 12, respectively, in the hypothetical cohort.<br />
There was also an increase of 45 cases of minor LEAs (130 versus 175 LEAs in the<br />
control and HBOT group, respectively). The incremental cost-effectiveness ratio (ICER)<br />
was estimated to be $27 310, $5 166, and $2 255 per QALY, at years 1, 5, and 12,<br />
respectively. In the scenario analyses, the ICERs varied substantially. Results were very<br />
sensitive to the efficaciousness probabilities. For example, the CE ratio at year 1 was<br />
$142 923, $27 310 per QALY, and cost saving ($-72 799) in the worst, base, and best<br />
case scenarios, respectively. Results were also sensitive to the quality weights, especially<br />
for major LEA, the number of HBOT sessions per case, the HBOT cost per treatment,<br />
and the treatment costs of major and minor LEA per case.<br />
The authors concluded that HBOT in the treatment of diabetic ulcers was cost<br />
effective, especially in the long term. They also acknowledged that results were limited<br />
by the clinical studies that provide the basis of the estimates.<br />
4.3.1.3 Hailey et al. 79<br />
The Canadian study of Hailey et al. (2007) used a decision model to estimate the costeffectiveness<br />
of adjunctive HBOT in comparison with standard care alone. The model<br />
used a 65-year-old patient cohort with diabetic foot ulcers. The model was very similar<br />
to that of Guo et al. 81 with the addition of one extra health state, i.e. unhealed. Results<br />
were expressed in costs per QALY. The related utilities for the health states were 0.6<br />
for a primarily healed wound, 0.61 for healed with a minor LEA, 0.31 for healed with a<br />
major LEA, 0.44 if unhealed with no related surgery, and 0 for death. 97, 106 Table 9<br />
presents outcome probabilities in the first year and mortality parameters.


