

Hyperbare Zuurstoftherapie: Rapid Assessment - KCE
Hyperbare Zuurstoftherapie: Rapid Assessment - KCE
Hyperbare Zuurstoftherapie: Rapid Assessment - KCE

Create successful ePaper yourself
Turn your PDF publications into a flip-book with our unique Google optimized e-Paper software.
<strong>KCE</strong> Reports 74 Hyperbaric Oxygenation Therapy 71<br />
Table 24. Floor space assumptions for overhead costs<br />
Floor space assumptions Source<br />
Monoplace 13.5 m 2 Treweek et al. 133 (“3m x 4.5m x 3m”)<br />
6-persons chamber 65 m 2 AZ St Jan Brugge<br />
12-persons<br />
chamber<br />
88 m 2 UZ Antwerpen<br />
5.9.3 Overview of analyzed scenarios<br />
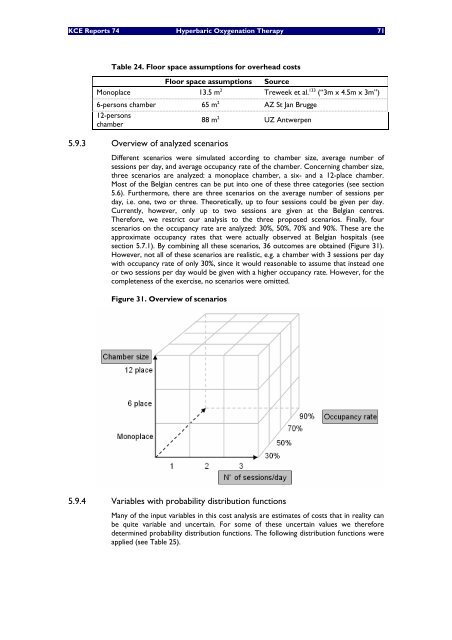
Different scenarios were simulated according to chamber size, average number of<br />
sessions per day, and average occupancy rate of the chamber. Concerning chamber size,<br />
three scenarios are analyzed: a monoplace chamber, a six- and a 12-place chamber.<br />
Most of the Belgian centres can be put into one of these three categories (see section<br />
5.6). Furthermore, there are three scenarios on the average number of sessions per<br />
day, i.e. one, two or three. Theoretically, up to four sessions could be given per day.<br />
Currently, however, only up to two sessions are given at the Belgian centres.<br />
Therefore, we restrict our analysis to the three proposed scenarios. Finally, four<br />
scenarios on the occupancy rate are analyzed: 30%, 50%, 70% and 90%. These are the<br />
approximate occupancy rates that were actually observed at Belgian hospitals (see<br />
section 5.7.1). By combining all these scenarios, 36 outcomes are obtained (Figure 31).<br />
However, not all of these scenarios are realistic, e.g. a chamber with 3 sessions per day<br />
with occupancy rate of only 30%, since it would reasonable to assume that instead one<br />
or two sessions per day would be given with a higher occupancy rate. However, for the<br />
completeness of the exercise, no scenarios were omitted.<br />
Figure 31. Overview of scenarios<br />
5.9.4 Variables with probability distribution functions<br />
Many of the input variables in this cost analysis are estimates of costs that in reality can<br />
be quite variable and uncertain. For some of these uncertain values we therefore<br />
determined probability distribution functions. The following distribution functions were<br />
applied (see Table 25).


