Student Resources—746
Student Resources—746
Student Resources—746

Create successful ePaper yourself
Turn your PDF publications into a flip-book with our unique Google optimized e-Paper software.
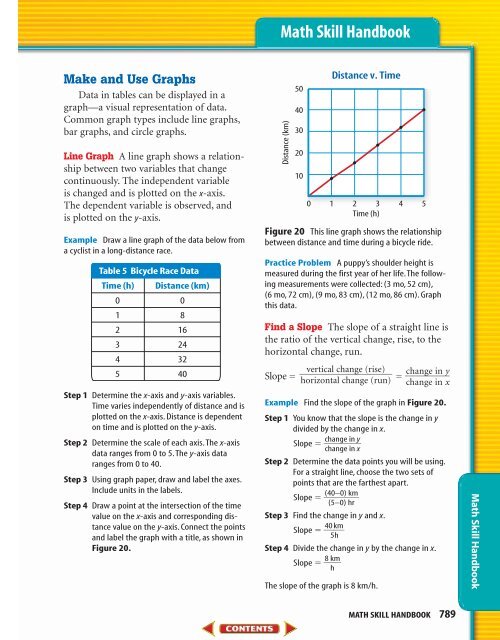
Make and Use Graphs<br />
Data in tables can be displayed in a<br />
graph—a visual representation of data.<br />
Common graph types include line graphs,<br />
bar graphs, and circle graphs.<br />
Line Graph A line graph shows a relationship<br />
between two variables that change<br />
continuously. The independent variable<br />
is changed and is plotted on the x-axis.<br />
The dependent variable is observed, and<br />
is plotted on the y-axis.<br />
Example Draw a line graph of the data below from<br />
a cyclist in a long-distance race.<br />
Table 5 Bicycle Race Data<br />
Time (h) Distance (km)<br />
0 0<br />
1 8<br />
2 16<br />
3 24<br />
4 32<br />
5 40<br />
Step 1 Determine the x-axis and y-axis variables.<br />
Time varies independently of distance and is<br />
plotted on the x-axis. Distance is dependent<br />
on time and is plotted on the y-axis.<br />
Step 2 Determine the scale of each axis.The x-axis<br />
data ranges from 0 to 5.The y-axis data<br />
ranges from 0 to 40.<br />
Step 3 Using graph paper, draw and label the axes.<br />
Include units in the labels.<br />
Step 4 Draw a point at the intersection of the time<br />
value on the x-axis and corresponding distance<br />
value on the y-axis. Connect the points<br />
and label the graph with a title, as shown in<br />
Figure 20.<br />
Math Skill Handbook<br />
Distance (km)<br />
50<br />
40<br />
30<br />
20<br />
10<br />
Distance v. Time<br />
0 1 2 3 4 5<br />
Time (h)<br />
Figure 20 This line graph shows the relationship<br />
between distance and time during a bicycle ride.<br />
Practice Problem A puppy’s shoulder height is<br />
measured during the first year of her life.The following<br />
measurements were collected: (3 mo, 52 cm),<br />
(6 mo, 72 cm), (9 mo, 83 cm), (12 mo, 86 cm). Graph<br />
this data.<br />
Find a Slope The slope of a straight line is<br />
the ratio of the vertical change, rise, to the<br />
horizontal change, run.<br />
vertical change (rise) ch<br />
Slope ange<br />
in<br />
y<br />
horizontal change (run)<br />
change<br />
in<br />
x<br />
Example Find the slope of the graph in Figure 20.<br />
Step 1 You know that the slope is the change in y<br />
divided by the change in x.<br />
Slope change<br />
in<br />
y<br />
<br />
change<br />
in<br />
x<br />
Step 2 Determine the data points you will be using.<br />
For a straight line, choose the two sets of<br />
points that are the farthest apart.<br />
Slope (40–<br />
0)<br />
km<br />
<br />
(5–<br />
0)<br />
hr<br />
Step 3 Find the change in y and x.<br />
Slope 40 km<br />
<br />
5h<br />
Step 4 Divide the change in y by the change in x.<br />
Slope 8km<br />
<br />
h<br />
The slope of the graph is 8 km/h.<br />
MATH SKILL HANDBOOK 789<br />
Math Skill Handbook