Download (5Mb) - Covenant University Repository
Download (5Mb) - Covenant University Repository
Download (5Mb) - Covenant University Repository

You also want an ePaper? Increase the reach of your titles
YUMPU automatically turns print PDFs into web optimized ePapers that Google loves.
1182<br />
The result of the mean internal organs weight of the rats<br />
fed with the blends is presented in table 5. The mean liver<br />
weight for the control group was 5.41 ± 0.11 g, while<br />
those fed with only BSG dropped to 2.01 ± 0.685 g. The<br />
same was observed for the mean kidney weights, while<br />
others were within the range of the control 0.970 ± 0.05 g.<br />
Those fed in 100% BSG have their kidney weight reduced<br />
to 0.69 ± 0.09 g. Generally, the rats fed with 100% BSG<br />
have their liver, kidneys, lungs and heart weight reduced<br />
Canadian Journal of Pure and Applied Sciences<br />
Table 4. Weight gain by rats for each feed formulation per day.<br />
Feeding Weight at 0 day (g) Weight at 15 th day (g) Weight difference (g) Weight gain/day<br />
0% 52.55 ±2.250 108.15 ±4.551 55.60 3.706<br />
3% 55.50 ±2.700 112.65 ±1.750 57.15 3.810<br />
6% 49.55 ±3.350 102.40 ±2.70 52.85 3.520<br />
9% 49.15 ±4.351 85.15 ±2.550 36.00 2.400<br />
12% 44.10 ±3.900 57.70 ±2.400 13.6 0.907<br />
15% 42.29 ±2.100 49.71 ±3.170 7.42 0.495<br />
100% BSG 48.65 ±4.100 17.45 ±2.901 -31.20 2.080*<br />
* Weight loss<br />
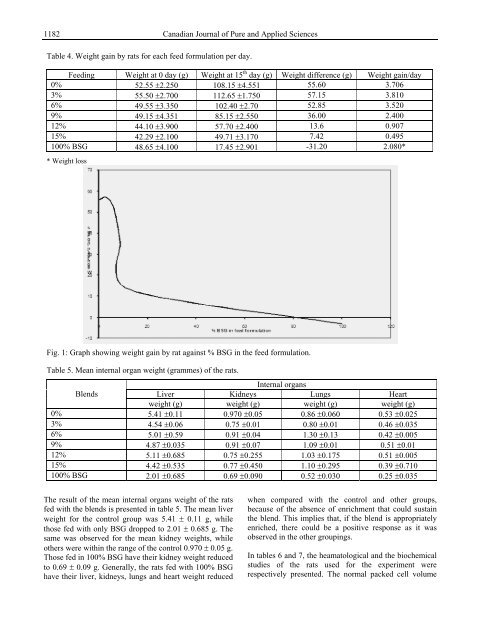
Fig. 1: Graph showing weight gain by rat against % BSG in the feed formulation.<br />
Table 5. Mean internal organ weight (grammes) of the rats.<br />
Blends<br />
Liver<br />
Internal organs<br />
Kidneys Lungs Heart<br />
weight (g) weight (g) weight (g) weight (g)<br />
0% 5.41 ±0.11 0.970 ±0.05 0.86 ±0.060 0.53 ±0.025<br />
3% 4.54 ±0.06 0.75 ±0.01 0.80 ±0.01 0.46 ±0.035<br />
6% 5.01 ±0.59 0.91 ±0.04 1.30 ±0.13 0.42 ±0.005<br />
9% 4.87 ±0.035 0.91 ±0.07 1.09 ±0.01 0.51 ±0.01<br />
12% 5.11 ±0.685 0.75 ±0.255 1.03 ±0.175 0.51 ±0.005<br />
15% 4.42 ±0.535 0.77 ±0.450 1.10 ±0.295 0.39 ±0.710<br />
100% BSG 2.01 ±0.685 0.69 ±0.090 0.52 ±0.030 0.25 ±0.035<br />
when compared with the control and other groups,<br />
because of the absence of enrichment that could sustain<br />
the blend. This implies that, if the blend is appropriately<br />
enriched, there could be a positive response as it was<br />
observed in the other groupings.<br />
In tables 6 and 7, the heamatological and the biochemical<br />
studies of the rats used for the experiment were<br />
respectively presented. The normal packed cell volume