Download (5Mb) - Covenant University Repository
Download (5Mb) - Covenant University Repository
Download (5Mb) - Covenant University Repository

Create successful ePaper yourself
Turn your PDF publications into a flip-book with our unique Google optimized e-Paper software.
eadings (Q), density (), viscosity (µ) and pipe diameter<br />
(D), for each run as follows:<br />
V. . D<br />
Re (1)<br />
<br />
(b) Percentage Drag Reduction calculations<br />
Pressure drop readings through testing sections before and<br />
after drag reducer addition, were needed to calculate the<br />
percentage drag reduction %Dr as follows (Virk, 1975)<br />
% Dr<br />
<br />
<br />
Pb<br />
P<br />
Pb <br />
RESULTS AND DISCUSSIONS<br />
a<br />
Effect of Fluid Velocity (Re)<br />
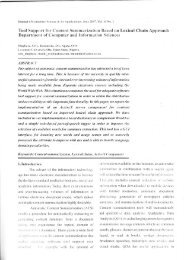
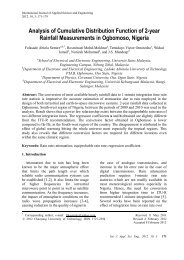
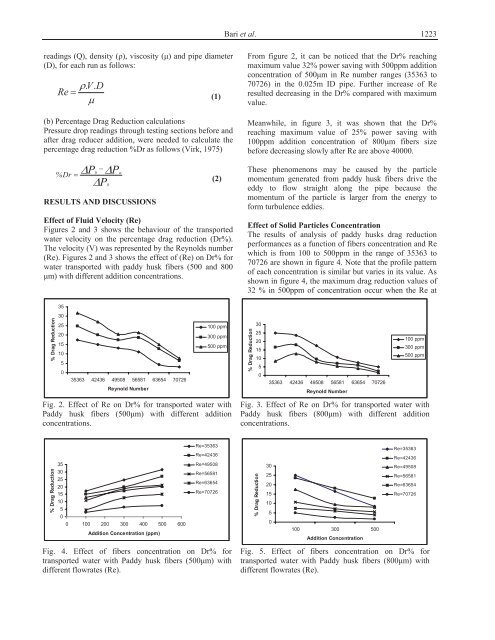
Figures 2 and 3 shows the behaviour of the transported<br />
water velocity on the percentage drag reduction (Dr%).<br />
The velocity (V) was represented by the Reynolds number<br />
(Re). Figures 2 and 3 shows the effect of (Re) on Dr% for<br />
water transported with paddy husk fibers (500 and 800<br />
µm) with different addition concentrations.<br />
% Drag Reduction<br />
35<br />
30<br />
25<br />
20<br />
15<br />
10<br />
5<br />
0<br />
35363 42436 49508 56581 63654 70726<br />
Reynold Number<br />
(2)<br />
100 ppm<br />
300 ppm<br />
500 ppm<br />
Fig. 2. Effect of Re on Dr% for transported water with<br />
Paddy husk fibers (500µm) with different addition<br />
concentrations.<br />
% Drag Reduction<br />
35<br />
30<br />
25<br />
20<br />
15<br />
10<br />
5<br />
0<br />
0 100 200 300 400 500 600<br />
Addition Concentration (ppm)<br />
Re=35363<br />
Re=42436<br />
Re=49508<br />
Re=56581<br />
Re=63654<br />
Re=70726<br />
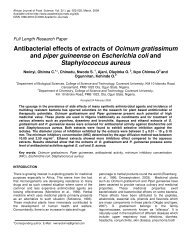
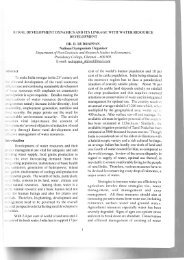
Fig. 4. Effect of fibers concentration on Dr% for<br />
transported water with Paddy husk fibers (500µm) with<br />
different flowrates (Re).<br />
Bari et al.<br />
1223<br />
From figure 2, it can be noticed that the Dr% reaching<br />
maximum value 32% power saving with 500ppm addition<br />
concentration of 500µm in Re number ranges (35363 to<br />
70726) in the 0.025m ID pipe. Further increase of Re<br />
resulted decreasing in the Dr% compared with maximum<br />
value.<br />
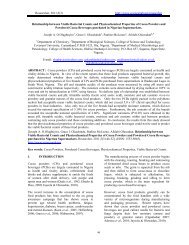
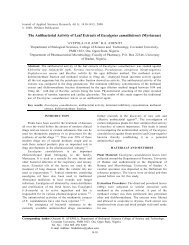
Meanwhile, in figure 3, it was shown that the Dr%<br />
reaching maximum value of 25% power saving with<br />
100ppm addition concentration of 800µm fibers size<br />
before decreasing slowly after Re are above 40000.<br />
These phenomenons may be caused by the particle<br />
momentum generated from paddy husk fibers drive the<br />
eddy to flow straight along the pipe because the<br />
momentum of the particle is larger from the energy to<br />
form turbulence eddies.<br />
Effect of Solid Particles Concentration<br />
The results of analysis of paddy husks drag reduction<br />
performances as a function of fibers concentration and Re<br />
which is from 100 to 500ppm in the range of 35363 to<br />
70726 are shown in figure 4. Note that the profile pattern<br />
of each concentration is similar but varies in its value. As<br />
shown in figure 4, the maximum drag reduction values of<br />
32 % in 500ppm of concentration occur when the Re at<br />
% Drag Reduction<br />
30<br />
25<br />
20<br />
15<br />
10<br />
5<br />
0<br />
35363 42436 49508 56581 63654 70726<br />
Reynold Number<br />
100 ppm<br />
300 ppm<br />
500 ppm<br />
Fig. 3. Effect of Re on Dr% for transported water with<br />
Paddy husk fibers (800µm) with different addition<br />
concentrations.<br />
% Drag Reduction<br />
30<br />
25<br />
20<br />
15<br />
10<br />
5<br />
0<br />
100 300<br />
Addition Concentration<br />
500<br />
Re=35363<br />
Re=42436<br />
Re=49508<br />
Re=56581<br />
Re=63654<br />
Re=70726<br />
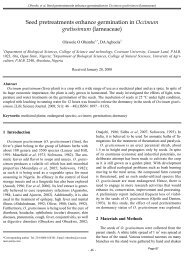
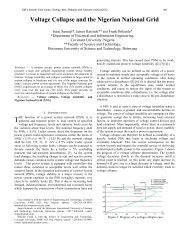
Fig. 5. Effect of fibers concentration on Dr% for<br />
transported water with Paddy husk fibers (800µm) with<br />
different flowrates (Re).