Download (5Mb) - Covenant University Repository
Download (5Mb) - Covenant University Repository
Download (5Mb) - Covenant University Repository

Create successful ePaper yourself
Turn your PDF publications into a flip-book with our unique Google optimized e-Paper software.
1204<br />
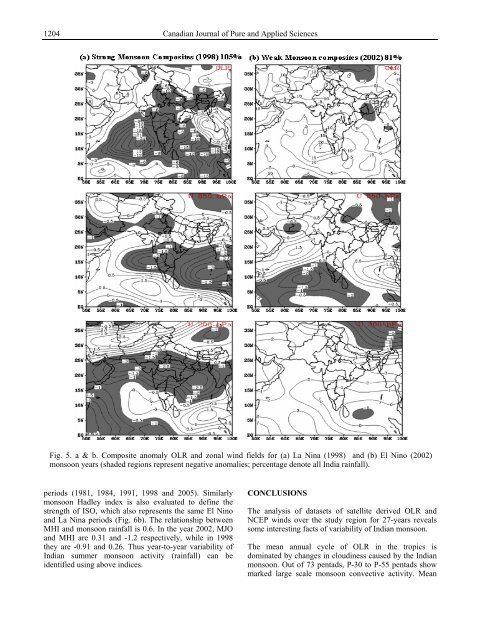
periods (1981, 1984, 1991, 1998 and 2005). Similarly<br />
monsoon Hadley index is also evaluated to define the<br />
strength of ISO, which also represents the same El Nino<br />
and La Nina periods (Fig. 6b). The relationship between<br />
MHI and monsoon rainfall is 0.6. In the year 2002, MJO<br />
and MHI are 0.31 and -1.2 respectively, while in 1998<br />
they are -0.91 and 0.26. Thus year-to-year variability of<br />
Indian summer monsoon activity (rainfall) can be<br />
identified using above indices.<br />
Canadian Journal of Pure and Applied Sciences<br />
Fig. 5. a & b. Composite anomaly OLR and zonal wind fields for (a) La Nina (1998) and (b) El Nino (2002)<br />
monsoon years (shaded regions represent negative anomalies; percentage denote all India rainfall).<br />
CONCLUSIONS<br />
The analysis of datasets of satellite derived OLR and<br />
NCEP winds over the study region for 27-years reveals<br />
some interesting facts of variability of Indian monsoon.<br />
The mean annual cycle of OLR in the tropics is<br />
dominated by changes in cloudiness caused by the Indian<br />
monsoon. Out of 73 pentads, P-30 to P-55 pentads show<br />
marked large scale monsoon convective activity. Mean