Download (5Mb) - Covenant University Repository
Download (5Mb) - Covenant University Repository
Download (5Mb) - Covenant University Repository

You also want an ePaper? Increase the reach of your titles
YUMPU automatically turns print PDFs into web optimized ePapers that Google loves.
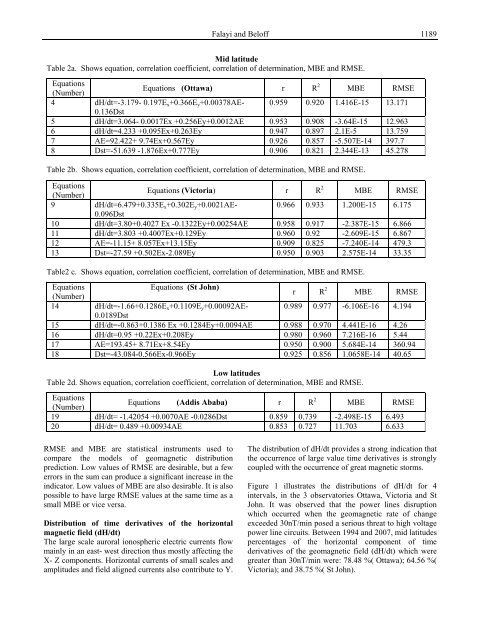
RMSE and MBE are statistical instruments used to<br />
compare the models of geomagnetic distribution<br />
prediction. Low values of RMSE are desirable, but a few<br />
errors in the sum can produce a significant increase in the<br />
indicator. Low values of MBE are also desirable. It is also<br />
possible to have large RMSE values at the same time as a<br />
small MBE or vice versa.<br />
Distribution of time derivatives of the horizontal<br />
magnetic field (dH/dt)<br />
The large scale auroral ionospheric electric currents flow<br />
mainly in an east- west direction thus mostly affecting the<br />
X- Z components. Horizontal currents of small scales and<br />
amplitudes and field aligned currents also contribute to Y.<br />
Falayi and Beloff 1189<br />
Mid latitude<br />
Table 2a. Shows equation, correlation coefficient, correlation of determination, MBE and RMSE.<br />
Equations<br />
(Number)<br />
Equations (Ottawa) r R 2 MBE RMSE<br />
4 dH/dt=-3.179- 0.197Ex+0.366Ey+0.00378AE-<br />
0.136Dst<br />
0.959 0.920 1.416E-15 13.171<br />
5 dH/dt=3.064- 0.0017Ex +0.256Ey+0.0012AE 0.953 0.908 -3.64E-15 12.963<br />
6 dH/dt=4.233 +0.095Ex+0.263Ey 0.947 0.897 2.1E-5 13.759<br />
7 AE=92.422+ 9.74Ex+0.567Ey 0.926 0.857 -5.507E-14 397.7<br />
8 Dst=-51.639 -1.876Ex+0.777Ey 0.906 0.821 2.344E-13 45.278<br />
Table 2b. Shows equation, correlation coefficient, correlation of determination, MBE and RMSE.<br />
Equations<br />
(Number)<br />
Equations (Victoria) r R 2 MBE RMSE<br />
9 dH/dt=6.479+0.335Ex+0.302Ey+0.0021AE-<br />
0.096Dst<br />
0.966 0.933 1.200E-15 6.175<br />
10 dH/dt=3.80+0.4027 Ex -0.1322Ey+0.00254AE 0.958 0.917 -2.387E-15 6.866<br />
11 dH/dt=3.803 +0.4007Ex+0.129Ey 0.960 0.92 -2.609E-15 6.867<br />
12 AE=-11.15+ 8.057Ex+13.15Ey 0.909 0.825 -7.240E-14 479.3<br />
13 Dst=-27.59 +0.502Ex-2.089Ey 0.950 0.903 2.575E-14 33.35<br />
Table2 c. Shows equation, correlation coefficient, correlation of determination, MBE and RMSE.<br />
Equations<br />
(Number)<br />
Equations (St John)<br />
r R 2 MBE RMSE<br />
14 dH/dt=-1.66+0.1286Ex+0.1109Ey+0.00092AE-<br />
0.0189Dst<br />
0.989 0.977 -6.106E-16 4.194<br />
15 dH/dt=-0.863+0.1386 Ex +0.1284Ey+0.0094AE 0.988 0.970 4.441E-16 4.26<br />
16 dH/dt=0.95 +0.22Ex+0.208Ey 0.980 0.960 7.216E-16 5.44<br />
17 AE=193.45+ 8.71Ex+8.54Ey 0.950 0.900 5.684E-14 360.94<br />
18 Dst=-43.084-0.566Ex-0.966Ey 0.925 0.856 1.0658E-14 40.65<br />
Low latitudes<br />
Table 2d. Shows equation, correlation coefficient, correlation of determination, MBE and RMSE.<br />
Equations<br />
(Number)<br />
Equations (Addis Ababa) r R 2 MBE RMSE<br />
19 dH/dt= -1.42054 +0.0070AE -0.0286Dst 0.859 0.739 -2.498E-15 6.493<br />
20 dH/dt= 0.489 +0.00934AE 0.853 0.727 11.703 6.633<br />
The distribution of dH/dt provides a strong indication that<br />
the occurrence of large value time derivatives is strongly<br />
coupled with the occurrence of great magnetic storms.<br />
Figure 1 illustrates the distributions of dH/dt for 4<br />
intervals, in the 3 observatories Ottawa, Victoria and St<br />
John. It was observed that the power lines disruption<br />
which occurred when the geomagnetic rate of change<br />
exceeded 30nT/min posed a serious threat to high voltage<br />
power line circuits. Between 1994 and 2007, mid latitudes<br />
percentages of the horizontal component of time<br />
derivatives of the geomagnetic field (dH/dt) which were<br />
greater than 30nT/min were: 78.48 %( Ottawa); 64.56 %(<br />
Victoria); and 38.75 %( St John).