An Analysis on Danish Micro Data - School of Economics and ...
An Analysis on Danish Micro Data - School of Economics and ...
An Analysis on Danish Micro Data - School of Economics and ...

Create successful ePaper yourself
Turn your PDF publications into a flip-book with our unique Google optimized e-Paper software.
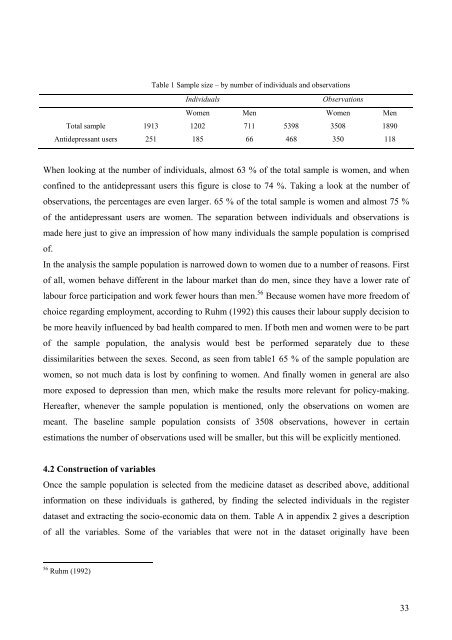
Table 1 Sample size – by number <strong>of</strong> individuals <strong>and</strong> observati<strong>on</strong>s<br />
Individuals Observati<strong>on</strong>s<br />
Women Men Women Men<br />
Total sample 1913 1202 711 5398 3508 1890<br />
<str<strong>on</strong>g>An</str<strong>on</strong>g>tidepressant users 251 185 66 468 350 118<br />
When looking at the number <strong>of</strong> individuals, almost 63 % <strong>of</strong> the total sample is women, <strong>and</strong> when<br />
c<strong>on</strong>fined to the antidepressant users this figure is close to 74 %. Taking a look at the number <strong>of</strong><br />
observati<strong>on</strong>s, the percentages are even larger. 65 % <strong>of</strong> the total sample is women <strong>and</strong> almost 75 %<br />
<strong>of</strong> the antidepressant users are women. The separati<strong>on</strong> between individuals <strong>and</strong> observati<strong>on</strong>s is<br />
made here just to give an impressi<strong>on</strong> <strong>of</strong> how many individuals the sample populati<strong>on</strong> is comprised<br />
<strong>of</strong>.<br />
In the analysis the sample populati<strong>on</strong> is narrowed down to women due to a number <strong>of</strong> reas<strong>on</strong>s. First<br />
<strong>of</strong> all, women behave different in the labour market than do men, since they have a lower rate <strong>of</strong><br />
labour force participati<strong>on</strong> <strong>and</strong> work fewer hours than men. 56 Because women have more freedom <strong>of</strong><br />
choice regarding employment, according to Ruhm (1992) this causes their labour supply decisi<strong>on</strong> to<br />
be more heavily influenced by bad health compared to men. If both men <strong>and</strong> women were to be part<br />
<strong>of</strong> the sample populati<strong>on</strong>, the analysis would best be performed separately due to these<br />
dissimilarities between the sexes. Sec<strong>on</strong>d, as seen from table1 65 % <strong>of</strong> the sample populati<strong>on</strong> are<br />
women, so not much data is lost by c<strong>on</strong>fining to women. <str<strong>on</strong>g>An</str<strong>on</strong>g>d finally women in general are also<br />
more exposed to depressi<strong>on</strong> than men, which make the results more relevant for policy-making.<br />
Hereafter, whenever the sample populati<strong>on</strong> is menti<strong>on</strong>ed, <strong>on</strong>ly the observati<strong>on</strong>s <strong>on</strong> women are<br />
meant. The baseline sample populati<strong>on</strong> c<strong>on</strong>sists <strong>of</strong> 3508 observati<strong>on</strong>s, however in certain<br />
estimati<strong>on</strong>s the number <strong>of</strong> observati<strong>on</strong>s used will be smaller, but this will be explicitly menti<strong>on</strong>ed.<br />
4.2 C<strong>on</strong>structi<strong>on</strong> <strong>of</strong> variables<br />
Once the sample populati<strong>on</strong> is selected from the medicine dataset as described above, additi<strong>on</strong>al<br />
informati<strong>on</strong> <strong>on</strong> these individuals is gathered, by finding the selected individuals in the register<br />
dataset <strong>and</strong> extracting the socio-ec<strong>on</strong>omic data <strong>on</strong> them. Table A in appendix 2 gives a descripti<strong>on</strong><br />
<strong>of</strong> all the variables. Some <strong>of</strong> the variables that were not in the dataset originally have been<br />
56 Ruhm (1992)<br />
33