An Analysis on Danish Micro Data - School of Economics and ...
An Analysis on Danish Micro Data - School of Economics and ...
An Analysis on Danish Micro Data - School of Economics and ...

Create successful ePaper yourself
Turn your PDF publications into a flip-book with our unique Google optimized e-Paper software.
antidepressant use <strong>on</strong> employment if the woman is not in the labour force to begin with. Galarraga<br />
et.al (2006) also menti<strong>on</strong> this as an important drawback to their analysis. Again the current dataset<br />
allows me to make this distincti<strong>on</strong>. This is d<strong>on</strong>e in the following. It should be noted though, that this<br />
distincti<strong>on</strong> does have c<strong>on</strong>sequences for the analysis. More than half <strong>of</strong> the sample populati<strong>on</strong> are<br />
outside the labour force, <strong>and</strong> excluding these women from the analysis reduces the sample<br />
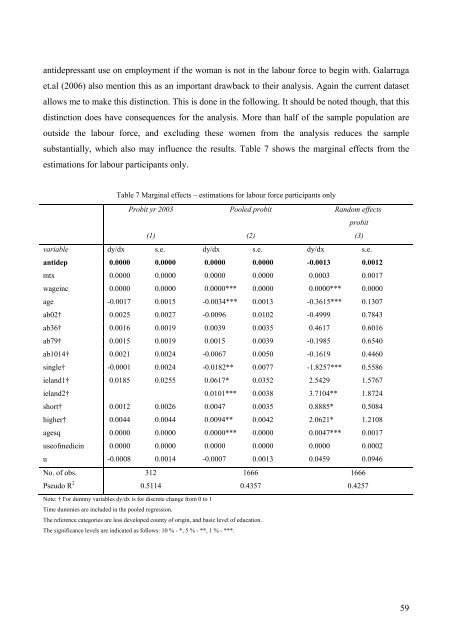
substantially, which also may influence the results. Table 7 shows the marginal effects from the<br />
estimati<strong>on</strong>s for labour participants <strong>on</strong>ly.<br />
Table 7 Marginal effects – estimati<strong>on</strong>s for labour force participants <strong>on</strong>ly<br />
Probit yr 2003<br />
(1)<br />
Pooled probit<br />
(2)<br />
R<strong>and</strong>om effects<br />
probit<br />
(3)<br />
variable dy/dx s.e. dy/dx s.e. dy/dx s.e.<br />
antidep 0.0000 0.0000 0.0000 0.0000 -0.0013 0.0012<br />
mtx 0.0000 0.0000 0.0000 0.0000 0.0003 0.0017<br />
wageinc 0.0000 0.0000 0.0000*** 0.0000 0.0000*** 0.0000<br />
age -0.0017 0.0015 -0.0034*** 0.0013 -0.3615*** 0.1307<br />
ab02† 0.0025 0.0027 -0.0096 0.0102 -0.4999 0.7843<br />
ab36† 0.0016 0.0019 0.0039 0.0035 0.4617 0.6016<br />
ab79† 0.0015 0.0019 0.0015 0.0039 -0.1985 0.6540<br />
ab1014† 0.0021 0.0024 -0.0067 0.0050 -0.1619 0.4460<br />
single† -0.0001 0.0024 -0.0182** 0.0077 -1.8257*** 0.5586<br />
iel<strong>and</strong>1† 0.0185 0.0255 0.0617* 0.0352 2.5429 1.5767<br />
iel<strong>and</strong>2† 0.0101*** 0.0038 3.7104** 1.8724<br />
short† 0.0012 0.0026 0.0047 0.0035 0.8885* 0.5084<br />
higher† 0.0044 0.0044 0.0094** 0.0042 2.0621* 1.2108<br />
agesq 0.0000 0.0000 0.0000*** 0.0000 0.0047*** 0.0017<br />
use<strong>of</strong>medicin 0.0000 0.0000 0.0000 0.0000 0.0000 0.0002<br />
u -0.0008 0.0014 -0.0007 0.0013 0.0459 0.0946<br />
No. <strong>of</strong> obs.<br />
Pseudo R 2<br />
312<br />
0.5114<br />
1666<br />
0.4357<br />
Note: † For dummy variables dy/dx is for discrete change from 0 to 1<br />
Time dummies are included in the pooled regressi<strong>on</strong>.<br />
The reference categories are less developed county <strong>of</strong> origin, <strong>and</strong> basic level <strong>of</strong> educati<strong>on</strong>.<br />
The significance levels are indicated as follows: 10 % - *, 5 % - **, 1 % - ***.<br />
1666<br />
0.4257<br />
59