An Analysis on Danish Micro Data - School of Economics and ...
An Analysis on Danish Micro Data - School of Economics and ...
An Analysis on Danish Micro Data - School of Economics and ...

You also want an ePaper? Increase the reach of your titles
YUMPU automatically turns print PDFs into web optimized ePapers that Google loves.
As established in chapter 4, the panel is unbalanced due to the way that the sample populati<strong>on</strong> is<br />
defined. In the pooled probit the reappearance <strong>of</strong> all observati<strong>on</strong> units is coincidental by assumpti<strong>on</strong><br />
<strong>and</strong> therefore ignored. The r<strong>and</strong>om effects probit model in c<strong>on</strong>trast, exploits the reappearance <strong>of</strong> the<br />
same observati<strong>on</strong> units. <str<strong>on</strong>g>An</str<strong>on</strong>g> unbalanced panel can bias the results when applying panel data<br />
methods, if the unbalanced panel is caused by sample selecti<strong>on</strong>. Therefore a test for sample<br />
selecti<strong>on</strong> is performed by including a lag <strong>of</strong> the selecti<strong>on</strong> indicator in the equati<strong>on</strong> <strong>of</strong> interest, as<br />
described in chapter 5. This test is performed <strong>on</strong> the r<strong>and</strong>om effects probit estimati<strong>on</strong>, <strong>and</strong> it is<br />
included in the appendices. With a coefficient <strong>of</strong> the lag <strong>of</strong> the selecti<strong>on</strong> indicator <strong>of</strong> -0.09917 <strong>and</strong> a<br />
st<strong>and</strong>ard error <strong>of</strong> 0.1625 the null hypothesis <strong>of</strong> no sample selecti<strong>on</strong> bias cannot be rejected. 70 This<br />
implies that the results are not biased due to sample selecti<strong>on</strong>.<br />
In chapter 5 a measure <strong>of</strong> ρ, the magnitude <strong>of</strong> the unobserved effect, was defined. When c<strong>on</strong>ducting<br />
the r<strong>and</strong>om effects probit estimati<strong>on</strong> in STATA, an estimate <strong>of</strong> ρ is automatically reported. The<br />
estimate <strong>of</strong> ρ for the r<strong>and</strong>om effects estimati<strong>on</strong> displayed in column 3 in table 3 is equal to 0.8065<br />
with a st<strong>and</strong>ard error <strong>of</strong> 0.0249. A likelihood-ratio test testing whether ρ is equal to 0 is rejected at a<br />
significance level <strong>of</strong> 1 %. It can therefore not be rejected that there is an unobserved effect present<br />
in the data.<br />
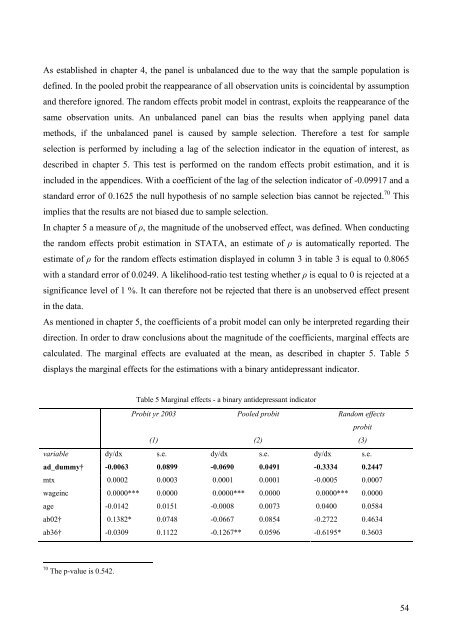
As menti<strong>on</strong>ed in chapter 5, the coefficients <strong>of</strong> a probit model can <strong>on</strong>ly be interpreted regarding their<br />
directi<strong>on</strong>. In order to draw c<strong>on</strong>clusi<strong>on</strong>s about the magnitude <strong>of</strong> the coefficients, marginal effects are<br />
calculated. The marginal effects are evaluated at the mean, as described in chapter 5. Table 5<br />
displays the marginal effects for the estimati<strong>on</strong>s with a binary antidepressant indicator.<br />
Table 5 Marginal effects - a binary antidepressant indicator<br />
Probit yr 2003<br />
(1)<br />
Pooled probit<br />
(2)<br />
R<strong>and</strong>om effects<br />
probit<br />
(3)<br />
variable dy/dx s.e. dy/dx s.e. dy/dx s.e.<br />
ad_dummy† -0.0063 0.0899 -0.0690 0.0491 -0.3334 0.2447<br />
mtx 0.0002 0.0003 0.0001 0.0001 -0.0005 0.0007<br />
wageinc 0.0000*** 0.0000 0.0000*** 0.0000 0.0000*** 0.0000<br />
age -0.0142 0.0151 -0.0008 0.0073 0.0400 0.0584<br />
ab02† 0.1382* 0.0748 -0.0667 0.0854 -0.2722 0.4634<br />
ab36† -0.0309 0.1122 -0.1267** 0.0596 -0.6195* 0.3603<br />
70 The p-value is 0.542.<br />
54