An Analysis on Danish Micro Data - School of Economics and ...
An Analysis on Danish Micro Data - School of Economics and ...
An Analysis on Danish Micro Data - School of Economics and ...

Create successful ePaper yourself
Turn your PDF publications into a flip-book with our unique Google optimized e-Paper software.
is perhaps not surprising, since they are all treated with medicati<strong>on</strong> for very serious illnesses <strong>and</strong><br />
they might simply not be able to work. Furthermore they might be outside the labour market for<br />
other reas<strong>on</strong>s, such as educati<strong>on</strong> or early retirement.<br />
Next some <strong>of</strong> the variables will be treated in more detail by looking at the correlati<strong>on</strong>s am<strong>on</strong>gst<br />
them.<br />
4.3.2 Correlati<strong>on</strong>s am<strong>on</strong>g the variables<br />
Percentage<br />
70<br />
60<br />
50<br />
40<br />
30<br />
20<br />
10<br />
0<br />
Employed Unemployed Outside the<br />
labour market<br />
Positi<strong>on</strong> in the labour market<br />
N<strong>on</strong>-antidep<br />
<str<strong>on</strong>g>An</str<strong>on</strong>g>tidep<br />
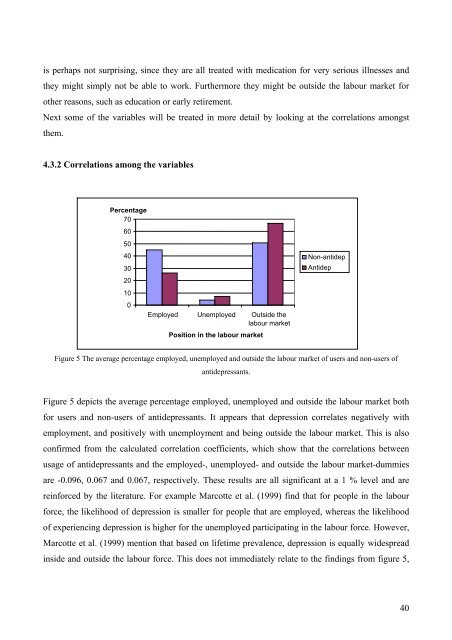
Figure 5 The average percentage employed, unemployed <strong>and</strong> outside the labour market <strong>of</strong> users <strong>and</strong> n<strong>on</strong>-users <strong>of</strong><br />
antidepressants.<br />
Figure 5 depicts the average percentage employed, unemployed <strong>and</strong> outside the labour market both<br />
for users <strong>and</strong> n<strong>on</strong>-users <strong>of</strong> antidepressants. It appears that depressi<strong>on</strong> correlates negatively with<br />
employment, <strong>and</strong> positively with unemployment <strong>and</strong> being outside the labour market. This is also<br />
c<strong>on</strong>firmed from the calculated correlati<strong>on</strong> coefficients, which show that the correlati<strong>on</strong>s between<br />
usage <strong>of</strong> antidepressants <strong>and</strong> the employed-, unemployed- <strong>and</strong> outside the labour market-dummies<br />
are -0.096, 0.067 <strong>and</strong> 0.067, respectively. These results are all significant at a 1 % level <strong>and</strong> are<br />
reinforced by the literature. For example Marcotte et al. (1999) find that for people in the labour<br />
force, the likelihood <strong>of</strong> depressi<strong>on</strong> is smaller for people that are employed, whereas the likelihood<br />
<strong>of</strong> experiencing depressi<strong>on</strong> is higher for the unemployed participating in the labour force. However,<br />
Marcotte et al. (1999) menti<strong>on</strong> that based <strong>on</strong> lifetime prevalence, depressi<strong>on</strong> is equally widespread<br />
inside <strong>and</strong> outside the labour force. This does not immediately relate to the findings from figure 5,<br />
40