An Analysis on Danish Micro Data - School of Economics and ...
An Analysis on Danish Micro Data - School of Economics and ...
An Analysis on Danish Micro Data - School of Economics and ...

You also want an ePaper? Increase the reach of your titles
YUMPU automatically turns print PDFs into web optimized ePapers that Google loves.
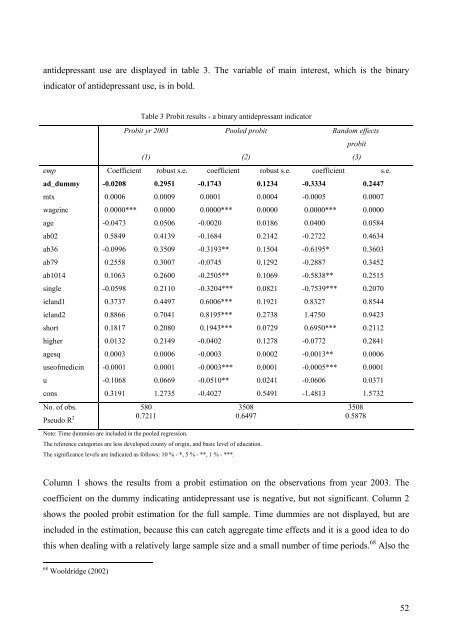
antidepressant use are displayed in table 3. The variable <strong>of</strong> main interest, which is the binary<br />
indicator <strong>of</strong> antidepressant use, is in bold.<br />
Table 3 Probit results - a binary antidepressant indicator<br />
Probit yr 2003<br />
(1)<br />
Pooled probit<br />
(2)<br />
R<strong>and</strong>om effects<br />
probit<br />
(3)<br />
emp Coefficient robust s.e. coefficient robust s.e. coefficient s.e.<br />
ad_dummy -0.0208 0.2951 -0.1743 0.1234 -0.3334 0.2447<br />
mtx 0.0006 0.0009 0.0001 0.0004 -0.0005 0.0007<br />
wageinc 0.0000*** 0.0000 0.0000*** 0.0000 0.0000*** 0.0000<br />
age -0.0473 0.0506 -0.0020 0.0186 0.0400 0.0584<br />
ab02 0.5849 0.4139 -0.1684 0.2142 -0.2722 0.4634<br />
ab36 -0.0996 0.3509 -0.3193** 0.1504 -0.6195* 0.3603<br />
ab79 0.2558 0.3007 -0.0745 0.1292 -0.2887 0.3452<br />
ab1014 0.1063 0.2600 -0.2505** 0.1069 -0.5838** 0.2515<br />
single -0.0598 0.2110 -0.3204*** 0.0821 -0.7539*** 0.2070<br />
iel<strong>and</strong>1 0.3737 0.4497 0.6006*** 0.1921 0.8327 0.8544<br />
iel<strong>and</strong>2 0.8866 0.7041 0.8195*** 0.2738 1.4750 0.9423<br />
short 0.1817 0.2080 0.1943*** 0.0729 0.6950*** 0.2112<br />
higher 0.0132 0.2149 -0.0402 0.1278 -0.0772 0.2841<br />
agesq 0.0003 0.0006 -0.0003 0.0002 -0.0013** 0.0006<br />
use<strong>of</strong>medicin -0.0001 0.0001 -0.0003*** 0.0001 -0.0005*** 0.0001<br />
u -0.1068 0.0669 -0.0510** 0.0241 -0.0606 0.0371<br />
c<strong>on</strong>s 0.3191 1.2735 -0.4027 0.5491 -1.4813 1.5732<br />
No. <strong>of</strong> obs.<br />
Pseudo R 2<br />
580<br />
0.7211<br />
3508<br />
0.6497<br />
Note: Time dummies are included in the pooled regressi<strong>on</strong>.<br />
The reference categories are less developed county <strong>of</strong> origin, <strong>and</strong> basic level <strong>of</strong> educati<strong>on</strong>.<br />
The significance levels are indicated as follows: 10 % - *, 5 % - **, 1 % - ***.<br />
3508<br />
0.5878<br />
Column 1 shows the results from a probit estimati<strong>on</strong> <strong>on</strong> the observati<strong>on</strong>s from year 2003. The<br />
coefficient <strong>on</strong> the dummy indicating antidepressant use is negative, but not significant. Column 2<br />
shows the pooled probit estimati<strong>on</strong> for the full sample. Time dummies are not displayed, but are<br />
included in the estimati<strong>on</strong>, because this can catch aggregate time effects <strong>and</strong> it is a good idea to do<br />
this when dealing with a relatively large sample size <strong>and</strong> a small number <strong>of</strong> time periods. 68 Also the<br />
68 Wooldridge (2002)<br />
52