An Analysis on Danish Micro Data - School of Economics and ...
An Analysis on Danish Micro Data - School of Economics and ...
An Analysis on Danish Micro Data - School of Economics and ...

You also want an ePaper? Increase the reach of your titles
YUMPU automatically turns print PDFs into web optimized ePapers that Google loves.
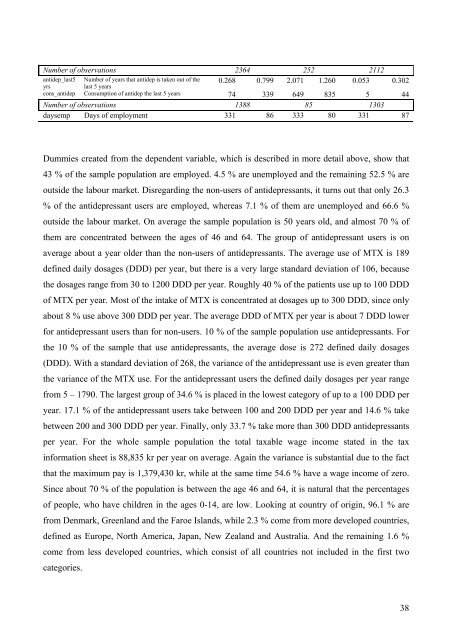
Number <strong>of</strong> observati<strong>on</strong>s 2364 252 2112<br />
antidep_last5 Number <strong>of</strong> years that antidep is taken out <strong>of</strong> the 0.268 0.799 2.071 1.260 0.053 0.302<br />
yrs<br />
last 5 years<br />
c<strong>on</strong>s_antidep C<strong>on</strong>sumpti<strong>on</strong> <strong>of</strong> antidep the last 5 years 74 339 649 835 5 44<br />
Number <strong>of</strong> observati<strong>on</strong>s 1388 85 1303<br />
daysemp Days <strong>of</strong> employment 331 86 333 80 331 87<br />
Dummies created from the dependent variable, which is described in more detail above, show that<br />
43 % <strong>of</strong> the sample populati<strong>on</strong> are employed. 4.5 % are unemployed <strong>and</strong> the remaining 52.5 % are<br />
outside the labour market. Disregarding the n<strong>on</strong>-users <strong>of</strong> antidepressants, it turns out that <strong>on</strong>ly 26.3<br />
% <strong>of</strong> the antidepressant users are employed, whereas 7.1 % <strong>of</strong> them are unemployed <strong>and</strong> 66.6 %<br />
outside the labour market. On average the sample populati<strong>on</strong> is 50 years old, <strong>and</strong> almost 70 % <strong>of</strong><br />
them are c<strong>on</strong>centrated between the ages <strong>of</strong> 46 <strong>and</strong> 64. The group <strong>of</strong> antidepressant users is <strong>on</strong><br />
average about a year older than the n<strong>on</strong>-users <strong>of</strong> antidepressants. The average use <strong>of</strong> MTX is 189<br />
defined daily dosages (DDD) per year, but there is a very large st<strong>and</strong>ard deviati<strong>on</strong> <strong>of</strong> 106, because<br />
the dosages range from 30 to 1200 DDD per year. Roughly 40 % <strong>of</strong> the patients use up to 100 DDD<br />
<strong>of</strong> MTX per year. Most <strong>of</strong> the intake <strong>of</strong> MTX is c<strong>on</strong>centrated at dosages up to 300 DDD, since <strong>on</strong>ly<br />
about 8 % use above 300 DDD per year. The average DDD <strong>of</strong> MTX per year is about 7 DDD lower<br />
for antidepressant users than for n<strong>on</strong>-users. 10 % <strong>of</strong> the sample populati<strong>on</strong> use antidepressants. For<br />
the 10 % <strong>of</strong> the sample that use antidepressants, the average dose is 272 defined daily dosages<br />
(DDD). With a st<strong>and</strong>ard deviati<strong>on</strong> <strong>of</strong> 268, the variance <strong>of</strong> the antidepressant use is even greater than<br />
the variance <strong>of</strong> the MTX use. For the antidepressant users the defined daily dosages per year range<br />
from 5 – 1790. The largest group <strong>of</strong> 34.6 % is placed in the lowest category <strong>of</strong> up to a 100 DDD per<br />
year. 17.1 % <strong>of</strong> the antidepressant users take between 100 <strong>and</strong> 200 DDD per year <strong>and</strong> 14.6 % take<br />
between 200 <strong>and</strong> 300 DDD per year. Finally, <strong>on</strong>ly 33.7 % take more than 300 DDD antidepressants<br />
per year. For the whole sample populati<strong>on</strong> the total taxable wage income stated in the tax<br />
informati<strong>on</strong> sheet is 88,835 kr per year <strong>on</strong> average. Again the variance is substantial due to the fact<br />
that the maximum pay is 1,379,430 kr, while at the same time 54.6 % have a wage income <strong>of</strong> zero.<br />
Since about 70 % <strong>of</strong> the populati<strong>on</strong> is between the age 46 <strong>and</strong> 64, it is natural that the percentages<br />
<strong>of</strong> people, who have children in the ages 0-14, are low. Looking at country <strong>of</strong> origin, 96.1 % are<br />
from Denmark, Greenl<strong>and</strong> <strong>and</strong> the Faroe Isl<strong>and</strong>s, while 2.3 % come from more developed countries,<br />
defined as Europe, North America, Japan, New Zeal<strong>and</strong> <strong>and</strong> Australia. <str<strong>on</strong>g>An</str<strong>on</strong>g>d the remaining 1.6 %<br />
come from less developed countries, which c<strong>on</strong>sist <strong>of</strong> all countries not included in the first two<br />
categories.<br />
38