An Analysis on Danish Micro Data - School of Economics and ...
An Analysis on Danish Micro Data - School of Economics and ...
An Analysis on Danish Micro Data - School of Economics and ...

Create successful ePaper yourself
Turn your PDF publications into a flip-book with our unique Google optimized e-Paper software.
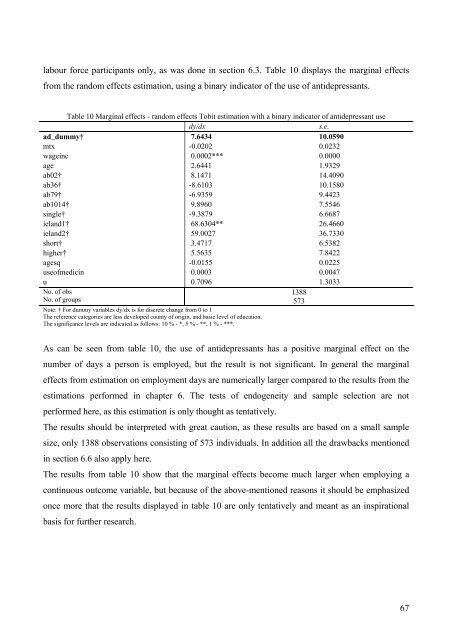
labour force participants <strong>on</strong>ly, as was d<strong>on</strong>e in secti<strong>on</strong> 6.3. Table 10 displays the marginal effects<br />
from the r<strong>and</strong>om effects estimati<strong>on</strong>, using a binary indicator <strong>of</strong> the use <strong>of</strong> antidepressants.<br />
Table 10 Marginal effects - r<strong>and</strong>om effects Tobit estimati<strong>on</strong> with a binary indicator <strong>of</strong> antidepressant use<br />
dy/dx s.e.<br />
ad_dummy† 7.6434 10.0590<br />
mtx -0.0202 0.0232<br />
wageinc 0.0002*** 0.0000<br />
age 2.6441 1.9329<br />
ab02† 8.1471 14.4090<br />
ab36† -8.6103 10.1580<br />
ab79† -6.9359 9.4423<br />
ab1014† 9.8960 7.5546<br />
single† -9.3879 6.6687<br />
iel<strong>and</strong>1† 68.6304** 26.4660<br />
iel<strong>and</strong>2† 59.0027 36.7330<br />
short† 3.4717 6.5382<br />
higher† 5.5635 7.8422<br />
agesq -0.0155 0.0225<br />
use<strong>of</strong>medicin 0.0003 0.0047<br />
u 0.7096 1.3033<br />
No. <strong>of</strong> obs<br />
No. <strong>of</strong> groups<br />
Note: † For dummy variables dy/dx is for discrete change from 0 to 1<br />
The reference categories are less developed county <strong>of</strong> origin, <strong>and</strong> basic level <strong>of</strong> educati<strong>on</strong>.<br />
The significance levels are indicated as follows: 10 % - *, 5 % - **, 1 % - ***.<br />
As can be seen from table 10, the use <strong>of</strong> antidepressants has a positive marginal effect <strong>on</strong> the<br />
number <strong>of</strong> days a pers<strong>on</strong> is employed, but the result is not significant. In general the marginal<br />
effects from estimati<strong>on</strong> <strong>on</strong> employment days are numerically larger compared to the results from the<br />
estimati<strong>on</strong>s performed in chapter 6. The tests <strong>of</strong> endogeneity <strong>and</strong> sample selecti<strong>on</strong> are not<br />
performed here, as this estimati<strong>on</strong> is <strong>on</strong>ly thought as tentatively.<br />
The results should be interpreted with great cauti<strong>on</strong>, as these results are based <strong>on</strong> a small sample<br />
size, <strong>on</strong>ly 1388 observati<strong>on</strong>s c<strong>on</strong>sisting <strong>of</strong> 573 individuals. In additi<strong>on</strong> all the drawbacks menti<strong>on</strong>ed<br />
in secti<strong>on</strong> 6.6 also apply here.<br />
The results from table 10 show that the marginal effects become much larger when employing a<br />
c<strong>on</strong>tinuous outcome variable, but because <strong>of</strong> the above-menti<strong>on</strong>ed reas<strong>on</strong>s it should be emphasized<br />
<strong>on</strong>ce more that the results displayed in table 10 are <strong>on</strong>ly tentatively <strong>and</strong> meant as an inspirati<strong>on</strong>al<br />
basis for further research.<br />
1388<br />
573<br />
67