Monitoring the scope and benefits of fairtrade
Monitoring the scope and benefits of fairtrade
Monitoring the scope and benefits of fairtrade

Create successful ePaper yourself
Turn your PDF publications into a flip-book with our unique Google optimized e-Paper software.
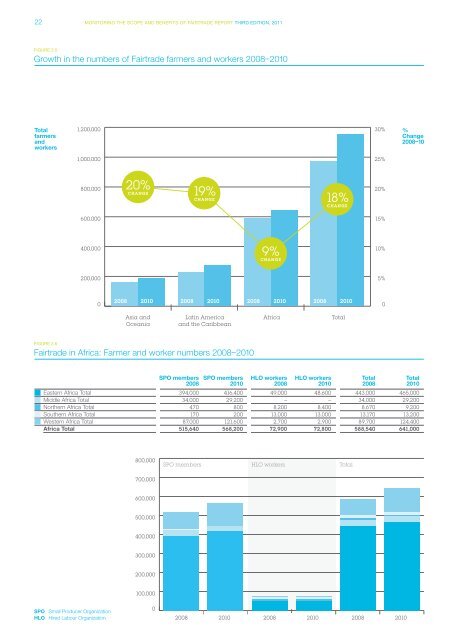
22 <strong>Monitoring</strong> <strong>the</strong> <strong>scope</strong> <strong>and</strong> <strong>benefits</strong> <strong>of</strong> <strong>fairtrade</strong> report third edition, 2011<br />
FIGURE 3.5<br />
Growth in <strong>the</strong> numbers <strong>of</strong> Fairtrade farmers <strong>and</strong> workers 2008–2010<br />
Total<br />
farmers<br />
<strong>and</strong><br />
workers<br />
1,200,000<br />
1,000,000<br />
800,000<br />
600,000<br />
400,000<br />
200,000<br />
FIGURE 3.6<br />
Fairtrade in Africa: Farmer <strong>and</strong> worker numbers 2008–2010<br />
SPO members SPO members HLO workers HLO workers Total Total<br />
2008 2010 2008 2010 2008 2010<br />
Eastern Africa Total 394,000 416,400 49,000 48,600 443,000 465,000<br />
Middle Africa Total 34,000 29,200 -- -- 34,000 29,200<br />
Nor<strong>the</strong>rn Africa Total 470 800 8,200 8,400 8,670 9,200<br />
Sou<strong>the</strong>rn Africa Total 170 200 13,000 13,000 13,170 13,200<br />
Western Africa Total 87,000 121,600 2,700 2,900 89,700 124,400<br />
Africa Total 515,640 568,200 72,900 72,800 588,540 641,000<br />
SPO Small Producer Organization<br />
HLO Hired Labour Organization<br />
0<br />
20%<br />
CHANGE 19%<br />
CHANGE<br />
2008 2010 2008 2010 2008 2010 2008 2010<br />
Asia <strong>and</strong><br />
Oceania<br />
800,000<br />
700,000<br />
600,000<br />
500,000<br />
400,000<br />
300,000<br />
200,000<br />
100,000<br />
0<br />
Latin America<br />
<strong>and</strong> <strong>the</strong> Caribbean<br />
9%<br />
CHANGE<br />
18%<br />
CHANGE<br />
Africa Total<br />
SPO members HLO workers Total<br />
30% %<br />
Change<br />
2008–10<br />
2008 2010 2008 2010 2008 2010<br />
25%<br />
20%<br />
15%<br />
10%<br />
5%<br />
0