Monitoring the scope and benefits of fairtrade
Monitoring the scope and benefits of fairtrade
Monitoring the scope and benefits of fairtrade

Create successful ePaper yourself
Turn your PDF publications into a flip-book with our unique Google optimized e-Paper software.
<strong>Monitoring</strong> <strong>the</strong> <strong>scope</strong> <strong>and</strong> <strong>benefits</strong> <strong>of</strong> <strong>fairtrade</strong> report third edition, 2011 43<br />
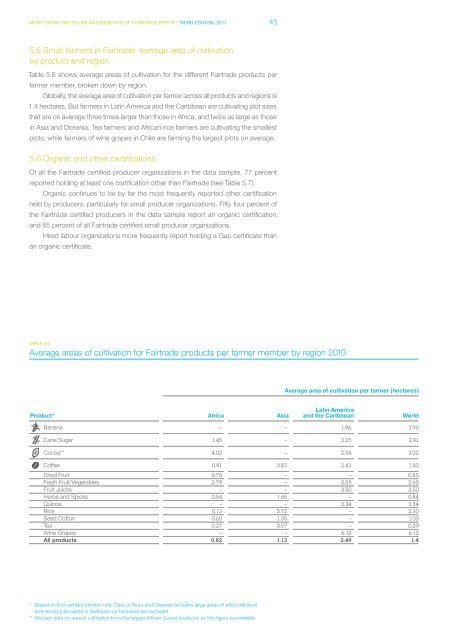
5.5 Small farmers in Fairtrade: average area <strong>of</strong> cultivation<br />
by product <strong>and</strong> region<br />
Table 5.6 shows average areas <strong>of</strong> cultivation for <strong>the</strong> different Fairtrade products per<br />
farmer member, broken down by region.<br />
Globally, <strong>the</strong> average area <strong>of</strong> cultivation per farmer across all products <strong>and</strong> regions is<br />
1.4 hectares. But farmers in Latin America <strong>and</strong> <strong>the</strong> Caribbean are cultivating plot sizes<br />
that are on average three times larger than those in Africa, <strong>and</strong> twice as large as those<br />
in Asia <strong>and</strong> Oceania. Tea farmers <strong>and</strong> African rice farmers are cultivating <strong>the</strong> smallest<br />
plots, while farmers <strong>of</strong> wine grapes in Chile are farming <strong>the</strong> largest plots on average.<br />
5.6 Organic <strong>and</strong> o<strong>the</strong>r certifications<br />
Of all <strong>the</strong> Fairtrade certified producer organizations in <strong>the</strong> data sample, 77 percent<br />
reported holding at least one certification o<strong>the</strong>r than Fairtrade (see Table 5.7).<br />
Organic continues to be by far <strong>the</strong> most frequently reported o<strong>the</strong>r certification<br />
held by producers, particularly for small producer organizations. Fifty four percent <strong>of</strong><br />
<strong>the</strong> Fairtrade certified producers in <strong>the</strong> data sample report an organic certification,<br />
<strong>and</strong> 65 percent <strong>of</strong> all Fairtrade certified small producer organizations.<br />
Hired labour organizations more frequently report holding a Gap certificate than<br />
an organic certificate.<br />
TABLE 5.6<br />
Average areas <strong>of</strong> cultivation for Fairtrade products per farmer member by region 2010<br />
Product* Africa<br />
Asia<br />
Average area <strong>of</strong> cultivation per farmer (hectares)<br />
Latin America<br />
<strong>and</strong> <strong>the</strong> Caribbean World<br />
Banana -- -- 1.96 1.96<br />
Cane Sugar 1.45 -- 3.25 2.91<br />
Cocoa** 4.02 -- 2.55 3.02<br />
C<strong>of</strong>fee 0.91 0.87 2.43 1.50<br />
Dried Fruit 0.75 -- -- 0.85<br />
Fresh Fruit/Vegetables 2.79 -- 2.05 2.60<br />
Fruit Juices -- -- 3.50 3.50<br />
Herbs <strong>and</strong> Spices 0.54 1.65 -- 0.84<br />
Quinoa -- -- 3.34 3.34<br />
Rice 0.13 2.72 -- 2.30<br />
Seed Cotton 0.60 1.35 -- 1.00<br />
Tea 0.27 0.57 -- 0.29<br />
Wine Grapes -- -- 6.12 6.12<br />
All products 0.82 1.13 2.49 1.4<br />
* Based on first certified product only. Data on Nuts <strong>and</strong> Oilseeds (includes large areas <strong>of</strong> wild collection)<br />
<strong>and</strong> Honey (calculated in beehives not hectares) are excluded.<br />
** We lack data on area <strong>of</strong> cultivation from <strong>the</strong> largest African Cocoa producer, so this figure is unreliable