Monitoring the scope and benefits of fairtrade
Monitoring the scope and benefits of fairtrade
Monitoring the scope and benefits of fairtrade

Create successful ePaper yourself
Turn your PDF publications into a flip-book with our unique Google optimized e-Paper software.
24 <strong>Monitoring</strong> <strong>the</strong> <strong>scope</strong> <strong>and</strong> <strong>benefits</strong> <strong>of</strong> <strong>fairtrade</strong> report third edition, 2011<br />
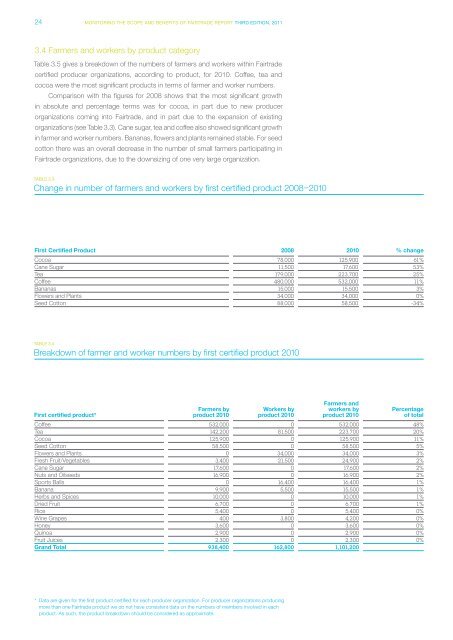
3.4 Farmers <strong>and</strong> workers by product category<br />
Table 3.5 gives a breakdown <strong>of</strong> <strong>the</strong> numbers <strong>of</strong> farmers <strong>and</strong> workers within Fairtrade<br />
certified producer organizations, according to product, for 2010. C<strong>of</strong>fee, tea <strong>and</strong><br />
cocoa were <strong>the</strong> most significant products in terms <strong>of</strong> farmer <strong>and</strong> worker numbers.<br />
Comparison with <strong>the</strong> figures for 2008 shows that <strong>the</strong> most significant growth<br />
in absolute <strong>and</strong> percentage terms was for cocoa, in part due to new producer<br />
organizations coming into Fairtrade, <strong>and</strong> in part due to <strong>the</strong> expansion <strong>of</strong> existing<br />
organizations (see Table 3.3). Cane sugar, tea <strong>and</strong> c<strong>of</strong>fee also showed significant growth<br />
in farmer <strong>and</strong> worker numbers. Bananas, flowers <strong>and</strong> plants remained stable. For seed<br />
cotton <strong>the</strong>re was an overall decrease in <strong>the</strong> number <strong>of</strong> small farmers participating in<br />
Fairtrade organizations, due to <strong>the</strong> downsizing <strong>of</strong> one very large organization.<br />
Table 3.3<br />
Change in number <strong>of</strong> farmers <strong>and</strong> workers by first certified product 2008–2010<br />
First Certified Product<br />
2008<br />
2010<br />
% change<br />
Cocoa 78,000 125,900 61%<br />
Cane Sugar 11,500 17,600 53%<br />
Tea 179,000 223,700 25%<br />
C<strong>of</strong>fee 480,000 532,000 11%<br />
Bananas 15,000 15,500 3%<br />
Flowers <strong>and</strong> Plants 34,000 34,000 0%<br />
Seed Cotton 88,000 58,500 -34%<br />
Table 3.4<br />
Breakdown <strong>of</strong> farmer <strong>and</strong> worker numbers by first certified product 2010<br />
First certified product*<br />
Farmers by<br />
product 2010<br />
Workers by<br />
product 2010<br />
Percentage<br />
<strong>of</strong> total<br />
C<strong>of</strong>fee 532,000 0 532,000 48%<br />
Tea 142,200 81,500 223,700 20%<br />
Cocoa 125,900 0 125,900 11%<br />
Seed Cotton 58,500 0 58,500 5%<br />
Flowers <strong>and</strong> Plants 0 34,000 34,000 3%<br />
Fresh Fruit/Vegetables 3,400 21,500 24,900 2%<br />
Cane Sugar 17,600 0 17,600 2%<br />
Nuts <strong>and</strong> Oilseeds 16,900 0 16,900 2%<br />
Sports Balls 0 16,400 16,400 1%<br />
Banana 9,900 5,500 15,500 1%<br />
Herbs <strong>and</strong> Spices 10,000 0 10,000 1%<br />
Dried Fruit 6,700 0 6,700 1%<br />
Rice 5,400 0 5,400 0%<br />
Wine Grapes 400 3,800 4,200 0%<br />
Honey 3,600 0 3,600 0%<br />
Quinoa 2,900 0 2,900 0%<br />
Fruit Juices 2,300 0 2,300 0%<br />
Gr<strong>and</strong> Total 938,400 162,800 1,101,200<br />
* Data are given for <strong>the</strong> first product certified for each producer organization. For producer organizations producing<br />
more than one Fairtrade product we do not have consistent data on <strong>the</strong> numbers <strong>of</strong> members involved in each<br />
product. As such, <strong>the</strong> product breakdown should be considered as approximate.<br />
Farmers <strong>and</strong><br />
workers by<br />
product 2010