Monitoring the scope and benefits of fairtrade
Monitoring the scope and benefits of fairtrade
Monitoring the scope and benefits of fairtrade

You also want an ePaper? Increase the reach of your titles
YUMPU automatically turns print PDFs into web optimized ePapers that Google loves.
46 <strong>Monitoring</strong> <strong>the</strong> <strong>scope</strong> <strong>and</strong> <strong>benefits</strong> <strong>of</strong> <strong>fairtrade</strong> report third edition, 2011<br />
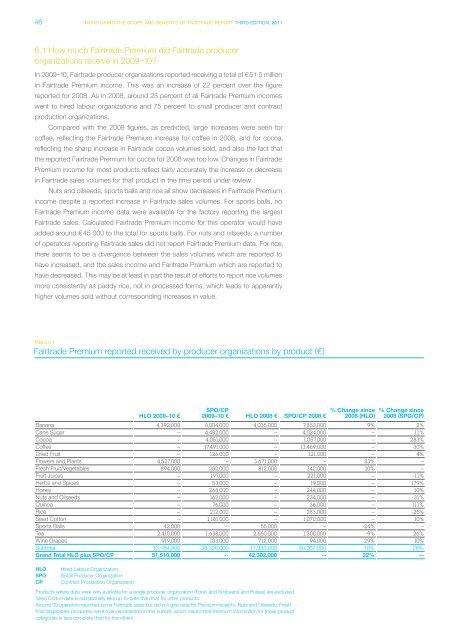
6.1 How much Fairtrade Premium did Fairtrade producer<br />
organizations receive in 2009–10?<br />
In 2009–10, Fairtrade producer organizations reported receiving a total <strong>of</strong> € 51.5 million<br />
in Fairtrade Premium income. This was an increase <strong>of</strong> 22 percent over <strong>the</strong> figure<br />
reported for 2008. As in 2008, around 25 percent <strong>of</strong> all Fairtrade Premium incomes<br />
went to hired labour organizations <strong>and</strong> 75 percent to small producer <strong>and</strong> contract<br />
production organizations.<br />
Compared with <strong>the</strong> 2008 figures, as predicted, large increases were seen for<br />
c<strong>of</strong>fee, reflecting <strong>the</strong> Fairtrade Premium increase for c<strong>of</strong>fee in 2008, <strong>and</strong> for cocoa,<br />
reflecting <strong>the</strong> sharp increase in Fairtrade cocoa volumes sold, <strong>and</strong> also <strong>the</strong> fact that<br />
<strong>the</strong> reported Fairtrade Premium for cocoa for 2008 was too low. Changes in Fairtrade<br />
Premium income for most products reflect fairly accurately <strong>the</strong> increase or decrease<br />
in Fairtrade sales volumes for that product in <strong>the</strong> time period under review.<br />
Nuts <strong>and</strong> oilseeds, sports balls <strong>and</strong> rice all show decreases in Fairtrade Premium<br />
income despite a reported increase in Fairtrade sales volumes. For sports balls, no<br />
Fairtrade Premium income data were available for <strong>the</strong> factory reporting <strong>the</strong> largest<br />
Fairtrade sales. Calculated Fairtrade Premium income for this operator would have<br />
added around € 45 000 to <strong>the</strong> total for sports balls. For nuts <strong>and</strong> oilseeds, a number<br />
<strong>of</strong> operators reporting Fairtrade sales did not report Fairtrade Premium data. For rice,<br />
<strong>the</strong>re seems to be a divergence between <strong>the</strong> sales volumes which are reported to<br />
have increased, <strong>and</strong> <strong>the</strong> sales income <strong>and</strong> Faritrade Premium which are reported to<br />
have decreased. This may be at least in part <strong>the</strong> result <strong>of</strong> efforts to report rice volumes<br />
more consistently as paddy rice, not in processed forms, which leads to apparently<br />
higher volumes sold without corresponding increases in value.<br />
TABLE 6.1<br />
Fairtrade Premium reported received by producer organizations by product (€)<br />
Banana 4,392,000 8,004,000 4,035,000 7,853,000 9% 2%<br />
Cane Sugar -- 4,482,000 -- 4,024,000 -- 11%<br />
Cocoa -- 4,051,000 -- 1,057,000 -- 283%<br />
C<strong>of</strong>fee -- 17,491,000 -- 13,469,000 -- 30%<br />
Dried Fruit -- 126,000 -- 121,000 -- 4%<br />
Flowers <strong>and</strong> Plants 4,527,000 -- 3,671,000 -- 23% --<br />
Fresh Fruit/Vegetables 894,000 282,000 812,000 342,000 10% --<br />
Fruit Juices -- 197,000 -- 221,000 -- -11%<br />
Herbs <strong>and</strong> Spices -- 53,000 -- 19,000 -- 179%<br />
Honey -- 268,000 -- 244,000 -- 10%<br />
Nuts <strong>and</strong> Oilseeds -- 162,000 -- 234,000 -- -31%<br />
Quinoa -- 76,000 -- 36,000 -- 111%<br />
Rice -- 212,000 -- 283,000 -- -25%<br />
Seed Cotton -- 1,181,000 -- 1,070,000 -- 10%<br />
Sports Balls 42,000 -- 55,000 -- -24% --<br />
Tea 2,410,000 1,638,000 2,650,000 1,300,000 -9% 26%<br />
Wine Grapes 919,000 103,000 712,000 94,000 29% 10%<br />
Subtotal 13,184,000 38,326,000 11,935,000 30,367,000 10% 26%<br />
Gr<strong>and</strong> Total HLO plus SPO/CP 51,510,000 -- 42,302,000 -- 22% --<br />
HLO Hired Labour Organization<br />
SPO Small Producer Organization<br />
CP Contract Production Organization<br />
HLO 2009–10 €<br />
SPO/CP<br />
2009–10 € HLO 2008 € SPO/CP 2008 €<br />
Products where data were only available for a single producer organization (Fonio <strong>and</strong> Soybeans <strong>and</strong> Pulses) are excluded.<br />
Seed Cotton data is substantially less up-to-date than that for o<strong>the</strong>r products.<br />
Around 50 operators reported some Fairtrade sales but did not give data for Premium receipts. Nuts <strong>and</strong> Oilseeds, Fresh<br />
Fruit/Vegetables producers were over-represented in this subset, which means that Premium information for <strong>the</strong>se product<br />
categories is less complete than for <strong>the</strong> o<strong>the</strong>rs.<br />
% Change since<br />
2008 (HLO)<br />
% Change since<br />
2008 (SPO/CP)