Monitoring the scope and benefits of fairtrade
Monitoring the scope and benefits of fairtrade
Monitoring the scope and benefits of fairtrade

You also want an ePaper? Increase the reach of your titles
YUMPU automatically turns print PDFs into web optimized ePapers that Google loves.
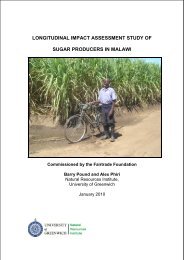
42 <strong>Monitoring</strong> <strong>the</strong> <strong>scope</strong> <strong>and</strong> <strong>benefits</strong> <strong>of</strong> <strong>fairtrade</strong> report third edition, 2011<br />
TABLE 5.4<br />
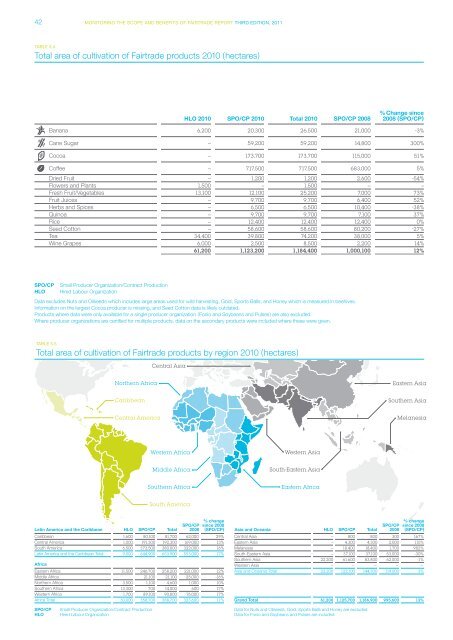
Total area <strong>of</strong> cultivation <strong>of</strong> Fairtrade products 2010 (hectares)<br />
HLO 2010 SPO/CP 2010 Total 2010 SPO/CP 2008<br />
% Change since<br />
2008 (SPO/CP)<br />
Banana 6,200 20,300 26,500 21,000 -3%<br />
Cane Sugar -- 59,200 59,200 14,800 300%<br />
Cocoa -- 173,700 173,700 115,000 51%<br />
C<strong>of</strong>fee -- 717,500 717,500 683,000 5%<br />
Dried Fruit -- 1,200 1,200 2,600 -54%<br />
Flowers <strong>and</strong> Plants 1,500 -- 1,500 -- --<br />
Fresh Fruit/Vegetables 13,100 12,100 25,200 7,000 73%<br />
Fruit Juices -- 9,700 9,700 6,400 52%<br />
Herbs <strong>and</strong> Spices -- 6,500 6,500 10,400 -38%<br />
Quinoa -- 9,700 9,700 7,100 37%<br />
Rice -- 12,400 12,400 12,400 0%<br />
Seed Cotton -- 58,600 58,600 80,200 -27%<br />
Tea 34,400 39,800 74,200 38,000 5%<br />
Wine Grapes 6,000 2,500 8,500 2,200 14%<br />
61,200 1,123,200 1,184,400 1,000,100 12%<br />
SPO/CP Small Producer Organization/Contract Production<br />
HLO Hired Labour Organization<br />
Data excludes Nuts <strong>and</strong> Oilseeds which includes large areas used for wild harvesting, Gold, Sports Balls, <strong>and</strong> Honey which is measured in beehives.<br />
Information on <strong>the</strong> largest Cocoa producer is missing, <strong>and</strong> Seed Cotton data is likely outdated.<br />
Products where data were only available for a single producer organization (Fonio <strong>and</strong> Soybeans <strong>and</strong> Pulses) are also excluded.<br />
Where producer organizations are certified for multiple products, data on <strong>the</strong> secondary products were included where <strong>the</strong>se were given.<br />
TABLE 5.5<br />
Total area <strong>of</strong> cultivation <strong>of</strong> Fairtrade products by region 2010 (hectares)<br />
Nor<strong>the</strong>rn Africa<br />
Caribbean<br />
Central America<br />
Central Asia<br />
Western Africa<br />
Middle Africa<br />
Sou<strong>the</strong>rn Africa<br />
South America<br />
Latin America <strong>and</strong> <strong>the</strong> Caribbean HLO SPO/CP Total SPO/CP<br />
2008<br />
Caribbean 1,600 80,100 81,700 62,000 29%<br />
Central America 1,000 191,300 192,300 169,000 13%<br />
South America 6,500 373,500 380,000 322,000 16%<br />
Latin America <strong>and</strong> <strong>the</strong> Caribbean Total 9,000 644,900 653,900 553,000 17%<br />
Africa<br />
Eastern Africa 11,500 246,700 258,200 221,000 12%<br />
Middle Africa 21,100 21,100 25,000 -16%<br />
Nor<strong>the</strong>rn Africa 3,500 1,100 4,600 1,000 10%<br />
Sou<strong>the</strong>rn Africa 13,300 700 14,000 600 17%<br />
Western Africa 1,700 89,100 90,800 76,000 17%<br />
Africa Total 30,000 358,700 388,700 323,600 11%<br />
SPO/CP Small Producer Organization/Contract Production<br />
HLO Hired Labour Organization<br />
Western Asia<br />
South-Eastern Asia<br />
Eastern Africa<br />
% change<br />
since 2008<br />
(SPO/CP) Asia <strong>and</strong> Oceania HLO SPO/CP Total SPO/CP<br />
2008<br />
Eastern Asia<br />
Sou<strong>the</strong>rn Asia<br />
Melanesia<br />
% change<br />
since 2008<br />
(SPO/CP)<br />
Central Asia -- 800 800 300 167%<br />
Eastern Asia -- 4,300 4,300 2,000 115%<br />
Melanesia -- 18,400 18,400 1,700 982%<br />
South-Eastern Asia -- 37,100 37,100 53,000 -30%<br />
Sou<strong>the</strong>rn Asia 22,200 61,600 83,800 62,000 -1%<br />
Western Asia -- -- -- -- --<br />
Asia <strong>and</strong> Oceania Total 22,200 122,100 144,300 119,000 3%<br />
Gr<strong>and</strong> Total 61,200 1,125,700 1,186,900 995,600 13%<br />
Data for Nuts <strong>and</strong> Oilseeds, Gold, Sports Balls <strong>and</strong> Honey are excluded.<br />
Data for Fonio <strong>and</strong> Soybeans <strong>and</strong> Pulses are included.