Monitoring the scope and benefits of fairtrade
Monitoring the scope and benefits of fairtrade
Monitoring the scope and benefits of fairtrade
You also want an ePaper? Increase the reach of your titles
YUMPU automatically turns print PDFs into web optimized ePapers that Google loves.
<strong>Monitoring</strong> <strong>the</strong> <strong>scope</strong> <strong>and</strong> <strong>benefits</strong> <strong>of</strong> <strong>fairtrade</strong> report third edition, 2011 31<br />
Top Ten Countries: Increase in number <strong>of</strong> Fairtrade certified producer organizations in 2010<br />
Peru 16<br />
Kenya 10<br />
Colombia 10<br />
India 10<br />
Occupied Palestinian Territories 8<br />
Cuba 7<br />
Côte d’Ivoire 5<br />
Nicaragua 4<br />
Chile 3<br />
China 3<br />
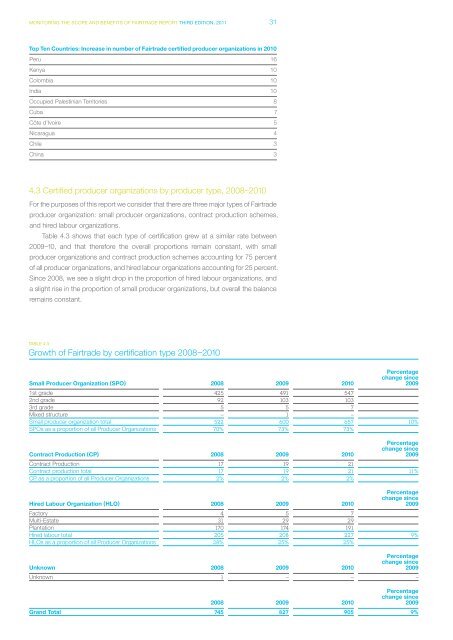
4.3 Certified producer organizations by producer type, 2008–2010<br />
For <strong>the</strong> purposes <strong>of</strong> this report we consider that <strong>the</strong>re are three major types <strong>of</strong> Fairtrade<br />
producer organization: small producer organizations, contract production schemes,<br />
<strong>and</strong> hired labour organizations.<br />
Table 4.3 shows that each type <strong>of</strong> certification grew at a similar rate between<br />
2009–10, <strong>and</strong> that <strong>the</strong>refore <strong>the</strong> overall proportions remain constant, with small<br />
producer organizations <strong>and</strong> contract production schemes accounting for 75 percent<br />
<strong>of</strong> all producer organizations, <strong>and</strong> hired labour organizations accounting for 25 percent.<br />
Since 2008, we see a slight drop in <strong>the</strong> proportion <strong>of</strong> hired labour organizations, <strong>and</strong><br />
a slight rise in <strong>the</strong> proportion <strong>of</strong> small producer organizations, but overall <strong>the</strong> balance<br />
remains constant.<br />
Table 4.3<br />
Growth <strong>of</strong> Fairtrade by certification type 2008–2010<br />
Percentage<br />
change since<br />
Small Producer Organization (SPO) 2008 2009 2010 2009<br />
1st grade 425 491 547<br />
2nd grade 92 103 103<br />
3rd grade 5 5 7<br />
Mixed structure -- 1 --<br />
Small producer organization total 522 600 657 10%<br />
SPOs as a proportion <strong>of</strong> all Producer Organizations 70% 73% 73%<br />
Percentage<br />
change since<br />
Contract Production (CP) 2008 2009 2010 2009<br />
Contract Production 17 19 21<br />
Contract production total 17 19 21 11%<br />
CP as a proportion <strong>of</strong> all Producer Organizations 2% 2% 2%<br />
Percentage<br />
change since<br />
Hired Labour Organization (HLO) 2008 2009 2010 2009<br />
Factory 4 5 7<br />
Multi-Estate 31 29 29<br />
Plantation 170 174 191<br />
Hired labour total 205 208 227 9%<br />
HLOs as a proportion <strong>of</strong> all Producer Organizations 28% 25% 25%<br />
Unknown 2008 2009 2010<br />
Percentage<br />
change since<br />
2009<br />
Unknown 1 -- -- --<br />
2008 2009 2010<br />
Percentage<br />
change since<br />
2009<br />
Gr<strong>and</strong> Total 745 827 905 9%


