Monitoring the scope and benefits of fairtrade
Monitoring the scope and benefits of fairtrade
Monitoring the scope and benefits of fairtrade

You also want an ePaper? Increase the reach of your titles
YUMPU automatically turns print PDFs into web optimized ePapers that Google loves.
<strong>Monitoring</strong> <strong>the</strong> <strong>scope</strong> <strong>and</strong> <strong>benefits</strong> <strong>of</strong> <strong>fairtrade</strong> report third edition, 2011 49<br />
When we look at <strong>the</strong> geographical distribution <strong>of</strong> Fairtrade Premium by region or<br />
by country, it is not surprising to see that <strong>the</strong> regions that receive <strong>the</strong> most amount<br />
<strong>of</strong> Fairtrade Premium are those producing large quantities <strong>of</strong> <strong>the</strong> major Fairtrade<br />
products. The major banana, sugar <strong>and</strong> c<strong>of</strong>fee producing countries feature strongly<br />
in <strong>the</strong> top ten Fairtrade Premium-receiving countries, which account for almost €35<br />
million, or 75 percent <strong>of</strong> all Fairtrade Premium received.<br />
When we look at <strong>the</strong> per capita distribution <strong>of</strong> Fairtrade Premium between<br />
regions, we see again <strong>the</strong> dilution effect <strong>of</strong> <strong>the</strong> very large numbers <strong>of</strong> members <strong>and</strong><br />
workers in Eastern, Western <strong>and</strong> Middle Africa. For example, although <strong>the</strong> total Fairtrade<br />
Premium levels received per region are similar, <strong>the</strong> per capita Fairtrade Premium for<br />
South America is six times that for Africa because <strong>the</strong> producer organizations in Latin<br />
America have a smaller average membership.<br />
Overall, <strong>the</strong> average Fairtrade Premium received per Fairtrade producer<br />
organization was €80 000, <strong>the</strong> same for both small producer <strong>and</strong> hired labour<br />
organizations. This showed a strong increase on <strong>the</strong> figures reported in last year’s<br />
report, as did <strong>the</strong> per capita global averages for members <strong>and</strong> workers.<br />
FIGURE 6.4<br />
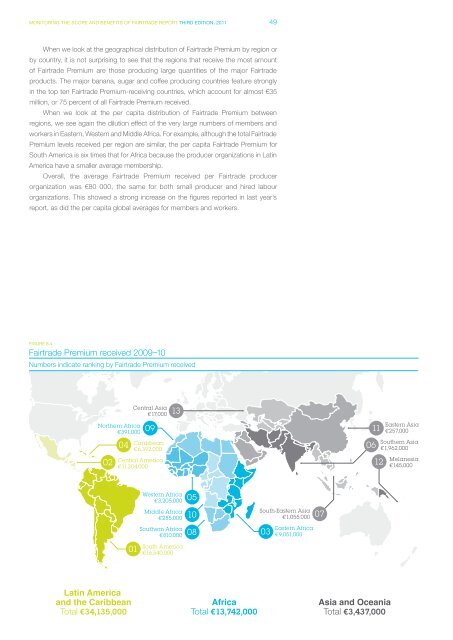
Fairtrade Premium received 2009–10<br />
Numbers indicate ranking by Fairtrade Premium received<br />
Nor<strong>the</strong>rn Africa<br />
€391,000<br />
02<br />
04<br />
Latin America<br />
<strong>and</strong> <strong>the</strong> Caribbean<br />
Total €34,135,000<br />
Central Asia<br />
€17,000<br />
Caribbean<br />
€6,392,000<br />
Central America<br />
€11,204,000<br />
01<br />
09<br />
13<br />
Western Africa<br />
€3,205,000<br />
Middle Africa<br />
€285,000<br />
Sou<strong>the</strong>rn Africa<br />
€810,000<br />
South America<br />
€16,540,000<br />
05<br />
10<br />
08 03<br />
Africa<br />
Total €13,742,000<br />
South-Eastern Asia<br />
€1,055,000<br />
Eastern Africa<br />
€9,051,000<br />
07<br />
06<br />
11<br />
12<br />
Asia <strong>and</strong> Oceania<br />
Total €3,437,000<br />
Eastern Asia<br />
€257,000<br />
Sou<strong>the</strong>rn Asia<br />
€1,962,000<br />
Melanesia<br />
€145,000