Monitoring the scope and benefits of fairtrade
Monitoring the scope and benefits of fairtrade
Monitoring the scope and benefits of fairtrade

Create successful ePaper yourself
Turn your PDF publications into a flip-book with our unique Google optimized e-Paper software.
<strong>Monitoring</strong> <strong>the</strong> <strong>scope</strong> <strong>and</strong> <strong>benefits</strong> <strong>of</strong> <strong>fairtrade</strong> report third edition, 2011 41<br />
h<strong>and</strong> <strong>and</strong> hired labour organizations on <strong>the</strong> o<strong>the</strong>r, with 60 percent <strong>of</strong> all hired labour<br />
organizations selling less than 25 percent <strong>of</strong> <strong>the</strong>ir total sales volume as Fairtrade.<br />
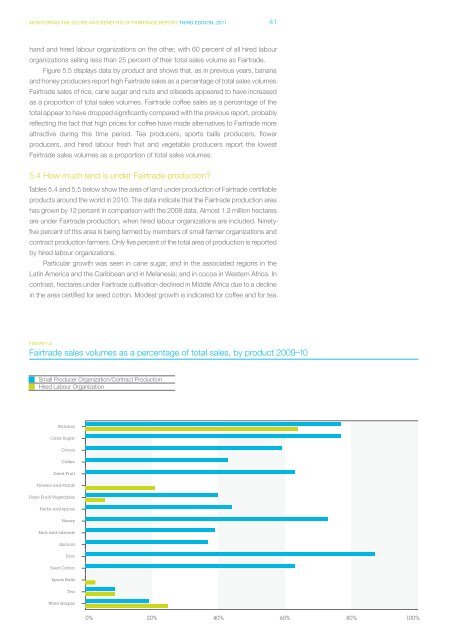
Figure 5.5 displays data by product <strong>and</strong> shows that, as in previous years, banana<br />
<strong>and</strong> honey producers report high Fairtrade sales as a percentage <strong>of</strong> total sales volumes.<br />
Fairtrade sales <strong>of</strong> rice, cane sugar <strong>and</strong> nuts <strong>and</strong> oilseeds appeared to have increased<br />
as a proportion <strong>of</strong> total sales volumes. Fairtrade c<strong>of</strong>fee sales as a percentage <strong>of</strong> <strong>the</strong><br />
total appear to have dropped significantly compared with <strong>the</strong> previous report, probably<br />
reflecting <strong>the</strong> fact that high prices for c<strong>of</strong>fee have made alternatives to Fairtrade more<br />
attractive during this time period. Tea producers, sports balls producers, flower<br />
producers, <strong>and</strong> hired labour fresh fruit <strong>and</strong> vegetable producers report <strong>the</strong> lowest<br />
Fairtrade sales volumes as a proportion <strong>of</strong> total sales volumes.<br />
5.4 How much l<strong>and</strong> is under Fairtrade production?<br />
Tables 5.4 <strong>and</strong> 5.5 below show <strong>the</strong> area <strong>of</strong> l<strong>and</strong> under production <strong>of</strong> Fairtrade certifiable<br />
products around <strong>the</strong> world in 2010. The data indicate that <strong>the</strong> Fairtrade production area<br />
has grown by 12 percent in comparison with <strong>the</strong> 2008 data. Almost 1.2 million hectares<br />
are under Fairtrade production, when hired labour organizations are included. Ninety-<br />
five percent <strong>of</strong> this area is being farmed by members <strong>of</strong> small farmer organizations <strong>and</strong><br />
contract production farmers. Only five percent <strong>of</strong> <strong>the</strong> total area <strong>of</strong> production is reported<br />
by hired labour organizations.<br />
Particular growth was seen in cane sugar, <strong>and</strong> in <strong>the</strong> associated regions in <strong>the</strong><br />
Latin America <strong>and</strong> <strong>the</strong> Caribbean <strong>and</strong> in Melanesia; <strong>and</strong> in cocoa in Western Africa. In<br />
contrast, hectares under Fairtrade cultivation declined in Middle Africa due to a decline<br />
in <strong>the</strong> area certified for seed cotton. Modest growth is indicated for c<strong>of</strong>fee <strong>and</strong> for tea.<br />
FIGURE Page 5.5 35: Table 5.4<br />
Fairtrade sales volumes as a percentage <strong>of</strong> total sales, by product 2009–10<br />
Small Producer Organization/Contract Production<br />
Hired Labour Organization<br />
Banana<br />
Cane Sugar<br />
Cocoa<br />
C<strong>of</strong>fee<br />
Dried Fruit<br />
Flowers <strong>and</strong> Plants<br />
Fresh Fruit/Vegetables<br />
Herbs <strong>and</strong> spices<br />
Honey<br />
Nuts <strong>and</strong> oilseeds<br />
Quinoa<br />
Rice<br />
Seed Cotton<br />
Sports Balls<br />
Tea<br />
Wine Grapes<br />
0% 20% 40% 60% 80% 100%