

Troels Dyhr Pedersen.indd - Solid Mechanics
Troels Dyhr Pedersen.indd - Solid Mechanics
Troels Dyhr Pedersen.indd - Solid Mechanics

You also want an ePaper? Increase the reach of your titles
YUMPU automatically turns print PDFs into web optimized ePapers that Google loves.
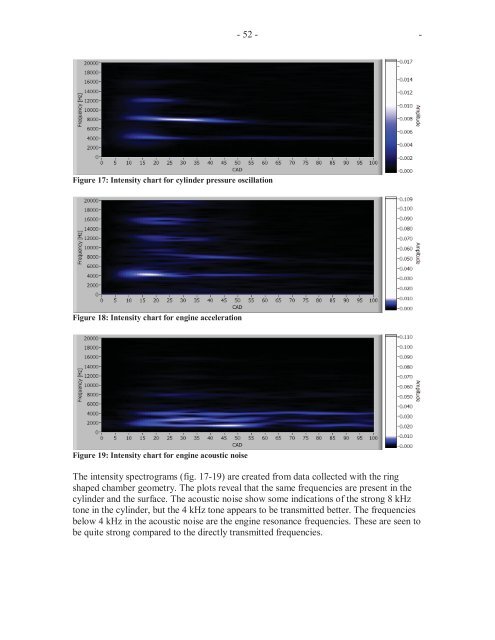
Figure 17: Intensity chart for cylinder pressure oscillation<br />
Figure 18: Intensity chart for engine acceleration<br />
Figure 19: Intensity chart for engine acoustic noise<br />
- 52 - -<br />
The intensity spectrograms (fig. 17-19) are created from data collected with the ring<br />
shaped chamber geometry. The plots reveal that the same frequencies are present in the<br />
cylinder and the surface. The acoustic noise show some indications of the strong 8 kHz<br />
tone in the cylinder, but the 4 kHz tone appears to be transmitted better. The frequencies<br />
below 4 kHz in the acoustic noise are the engine resonance frequencies. These are seen to<br />
be quite strong compared to the directly transmitted frequencies.


